Gold Weekly Forecast: Bulls take action on growing optimism about a permanent US-Iran truce
- Gold registered weekly gains despite opening with a bearish gap.
- US-Iran negotiations and the situation in the Strait of Hormuz could influence Gold’s valuation.
- The technical outlook highlights a moderately bullish stance in the short term.

Gold (XAU/USD) started the week on the back foot but managed to reverse its direction. Investors remain optimistic about a permanent ceasefire between the United States (US) and Iran following Iran’s decision to fully open the Strait of Hormuz to commercial vessels during the Israel-Lebanon ceasefire period.
Gold holds its ground as Middle East tensions ease
Markets turned risk-averse at the beginning of the week as the US and Iran failed to reach an agreement following their first round of talks, and US President Donald Trump announced the blockade of Iranian ports in the Strait of Hormuz. In turn, Gold opened with a bearish gap and dropped to a fresh weekly low below $4,650 during the Asian trading hours. In the second half of the day, improving risk mood helped the precious metal stage a rebound and end the day near the previous week’s closing level of $4,750. Trump said late Monday that the US had been approached by the "right people on Iran" and that they wanted a deal. Meanwhile, US Vice President JD Vance told Fox News that meaningful progress had been made in talks even though they failed to deliver a breakthrough.
President Trump told Fox News on Tuesday that the war with Iran was “very close to over” and repeated that Iran wanted to make a deal “very badly.” Meanwhile, the data from the US showed that producer inflation, as measured by the change in the Producer Price Index (PPI), climbed to 4% year-on-year in March from 3.4% in February. This reading came in well below the market expectation of 4.6%. As the US Dollar (USD) remained under bearish pressure, XAU/USD gained more than 2% and closed the day above $4,800.
Markets turned cautious midweek and Gold erased a portion of Tuesday’s gains as White House Press Secretary Karoline Leavitt denied reports claiming that the US was seeking a two-week extension to the ceasefire. On Thursday, Trump announced that Israel and Lebanon had agreed to a 10-day ceasefire, but Israeli Prime Minister Benjamin Netanyahu clarified that his country will not withdraw from southern Lebanon and place troops in a 10-km deep security zone. Meanwhile, Mohsen Rezaee, a senior politician and a military officer in the Iranian Revolutionary Guards, said that future negotiations are contingent on adherence to the conditions of Iran and the resistance. After closing in the red on Wednesday, XAU/USD entered a consolidation phase near $4,800 before regaining its traction ahead of the weekend.
Abbas Araghchi, the foreign minister of Iran, announced on Friday that, in line with the ceasefire in Lebanon, the passage for all commercial vessels through the Strait of Hormuz is declared completely open for the remaining period of ceasefire. Risk flows returned to markets following this development and Gold climbed toward $4,900 with the immediate reaction.
Gold traders will watch US-Iran negotiations closely
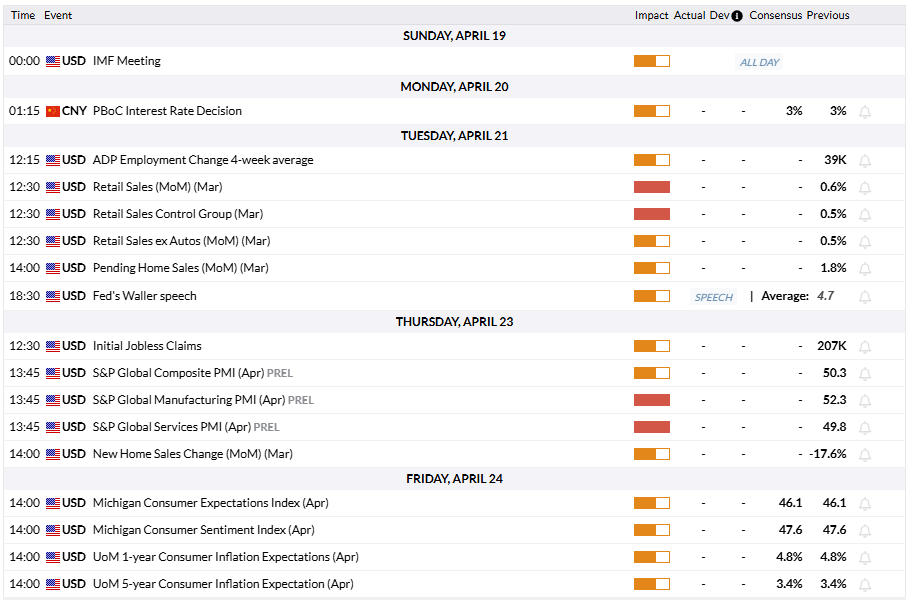
The US economic calendar will feature March Retail Sales data on Tuesday and the preliminary S&P Global Manufacturing and Services Purchasing Managers’ Index (PMI) data for April on Thursday. Markets will not receive any comments from the Federal Reserve’s (Fed) policymakers because the blackout period starts on April 18.
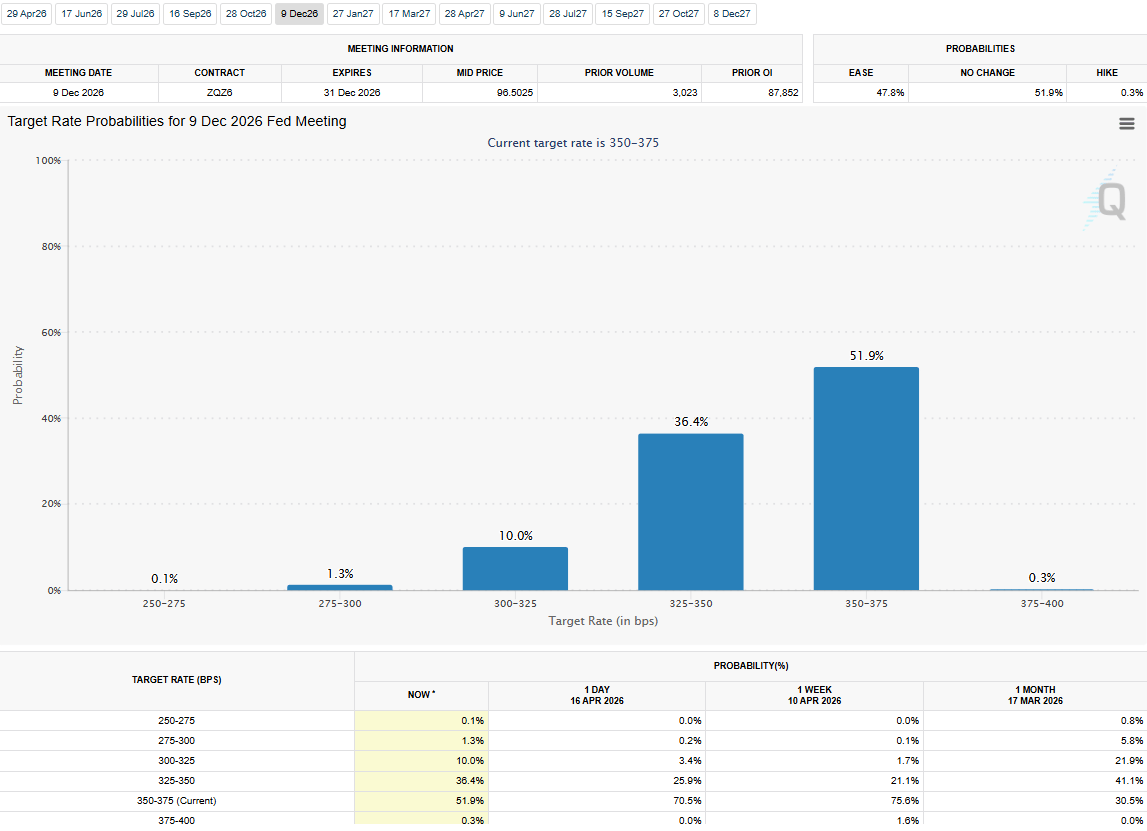
The sharp correction seen in Crude Oil prices following the announcement of the two-week US-Iran ceasefire and Iran’s decision to open the Strait of Hormuz eased concerns over a permanent increase in global inflation and allowed investors to reassess the Federal Reserve’s (Fed) policy outlook. The barrel of West Texas Intermediate (WTI) is down nearly 20% since the temporary truce was reached over a week ago. According to the CME FedWatch Tool, markets currently see no chance of an interest-rate hike this year and price in about a 52% probability of the Fed leaving rates unchanged by the end of 2026.
Market participants will scrutinize the details of the PMI surveys to see how impactful rising energy prices have been on input inflation. In case headline PMI prints come in near 50 and the publication highlights growing concerns over input costs remaining persistently high, the USD could stay resilient against its major currency peers with the immediate reaction, causing XAU/USD to edge lower. On the other hand, the pair could gain traction if PMI surveys suggest that the private sector is optimistic that input costs will only rise temporarily and that they won’t need to pass these costs on to consumers.
Still, headlines from the Middle East will likely continue to dominate markets in the near term. The US and Iran could reportedly hold the second round of negotiations this coming weekend. If there is an extension to the ceasefire, or a permanent truce deal, risk flows could continue to dominate the markets and pave the way for another leg lower in Oil prices. In this scenario, Gold could gather further bullish momentum. Conversely, the yellow metal could come under renewed selling pressure if sides fail to make progress and Trump refuses to extend the ceasefire.
Gold technical analysis points to modest bullish stance
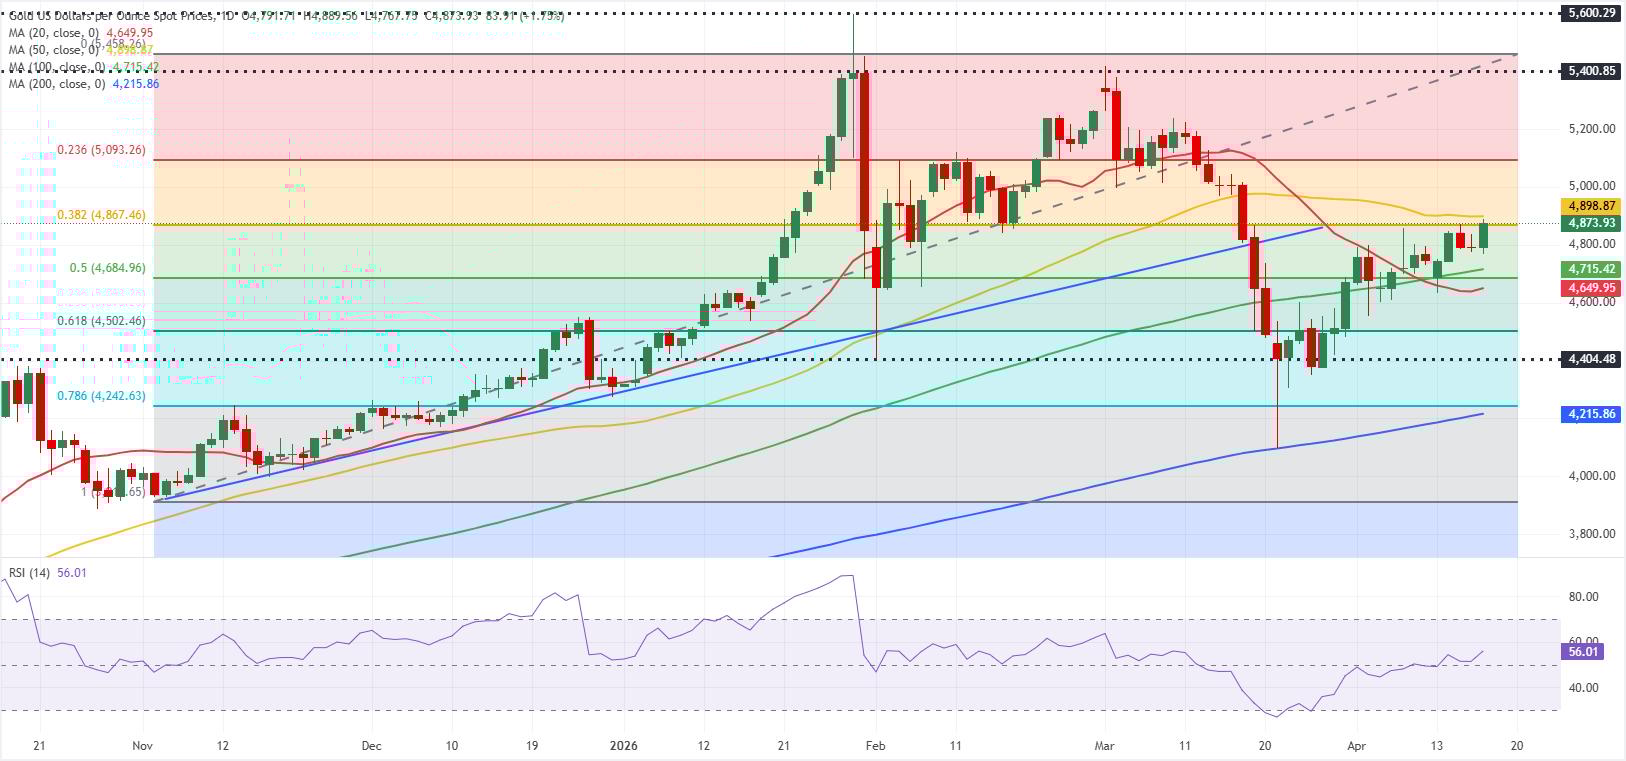
The Relative Strength Index (RSI) indicator on the daily edges higher while staying above 50, and Gold holds comfortably above the 100-day and the 20-day Simple Moving Averages (SMA). At the same time, XAU/USD is yet to clear the Fibonacci 38.2% retracement of the November-February uptrend, which is reinforced by the 50-day SMA, in a decisive way.
On the upside, the $4,865-$4,900 region (Fibonacci 38.2% retracement, 50-day SMA) remains intact as the next hurdle ahead of $5,000 (static and psychological level) and $5,100 (Fibonacci 23.6% retracement).
Looking south, the 100-day SMA forms a strong dynamic support, currently located at $4,715, just before the Fibonacci 50% retracement and $4,680. If this latter support fails, $4,500 (Fibonacci 61.8% retracement) could be set as the next bearish target.
Gold FAQs
Gold has played a key role in human’s history as it has been widely used as a store of value and medium of exchange. Currently, apart from its shine and usage for jewelry, the precious metal is widely seen as a safe-haven asset, meaning that it is considered a good investment during turbulent times. Gold is also widely seen as a hedge against inflation and against depreciating currencies as it doesn’t rely on any specific issuer or government.
Central banks are the biggest Gold holders. In their aim to support their currencies in turbulent times, central banks tend to diversify their reserves and buy Gold to improve the perceived strength of the economy and the currency. High Gold reserves can be a source of trust for a country’s solvency. Central banks added 1,136 tonnes of Gold worth around $70 billion to their reserves in 2022, according to data from the World Gold Council. This is the highest yearly purchase since records began. Central banks from emerging economies such as China, India and Turkey are quickly increasing their Gold reserves.
Gold has an inverse correlation with the US Dollar and US Treasuries, which are both major reserve and safe-haven assets. When the Dollar depreciates, Gold tends to rise, enabling investors and central banks to diversify their assets in turbulent times. Gold is also inversely correlated with risk assets. A rally in the stock market tends to weaken Gold price, while sell-offs in riskier markets tend to favor the precious metal.
The price can move due to a wide range of factors. Geopolitical instability or fears of a deep recession can quickly make Gold price escalate due to its safe-haven status. As a yield-less asset, Gold tends to rise with lower interest rates, while higher cost of money usually weighs down on the yellow metal. Still, most moves depend on how the US Dollar (USD) behaves as the asset is priced in dollars (XAU/USD). A strong Dollar tends to keep the price of Gold controlled, whereas a weaker Dollar is likely to push Gold prices up.
Author

Eren Sengezer
FXStreet
As an economist at heart, Eren Sengezer specializes in the assessment of the short-term and long-term impacts of macroeconomic data, central bank policies and political developments on financial assets.


