Gold steady ahead of Fed decision, rally seen resuming despite Iran tensions
- Gold prices were subdued Monday as investors awaited a crucial Federal Reserve rate decision later in the week and weighed rising oil prices driven by Middle East supply disruptions.
- Oil prices surged nearly 3% Monday as stalled U.S.-Iran peace talks and continued restrictions on Strait of Hormuz shipments tightened global supplies.
- Receding hopes of a peace deal after Axios report and Iran-related actions (Hormuz closure, canceled envoy trip) weigh on markets.
- Investors focus on central bank meetings—BOJ, ECB, Fed—expecting rates to be held steady.
- Analysts lifted their 2026 gold price forecasts, a Reuters poll showed on Monday, citing robust central bank buying and economic uncertainty that should counterbalance inflation spikes and hawkish policy bets tied to the Middle East conflict. The poll sees gold averaging $4,916/oz and silver $78/oz in 2026.
- Nickel jumped to a nearly two-year high on Monday amid concerns over supply from top producer Indonesia and a shortage of sulphur used in production.
- Analysts trimmed their 2026 platinum and palladium forecasts as speculative momentum fades and Middle East risks threaten growth and the auto sector, increasing market volatility. After surging 127% in 2025 and peaking at a record $2,918.80/oz in January on tight supply and gold’s rally, spot platinum is down 15% since U.S. and Israeli strikes on Iran two months ago.
- Federal Reserve policymakers will gather in Washington this week in what may be Jerome Powell's last meeting as head of the U.S. central bank, with energy prices still elevated and the Iran war at a standstill and likely to prolong uncertainty about the economic and monetary policy outlook.

Spot gold modestly declined 0.12% to $4,703.77 an ounce by 07:25 ET (11:25 GMT), while U.S. gold futures fell 0.44% to $4,721.00 an ounce.
Gold is viewed as an inflation hedge, but rising interest rates boost yield-bearing assets, and a stronger dollar raises bullion's cost for overseas buyers.
CME FedWatch:
Current target rate = 3.50 - 3.75
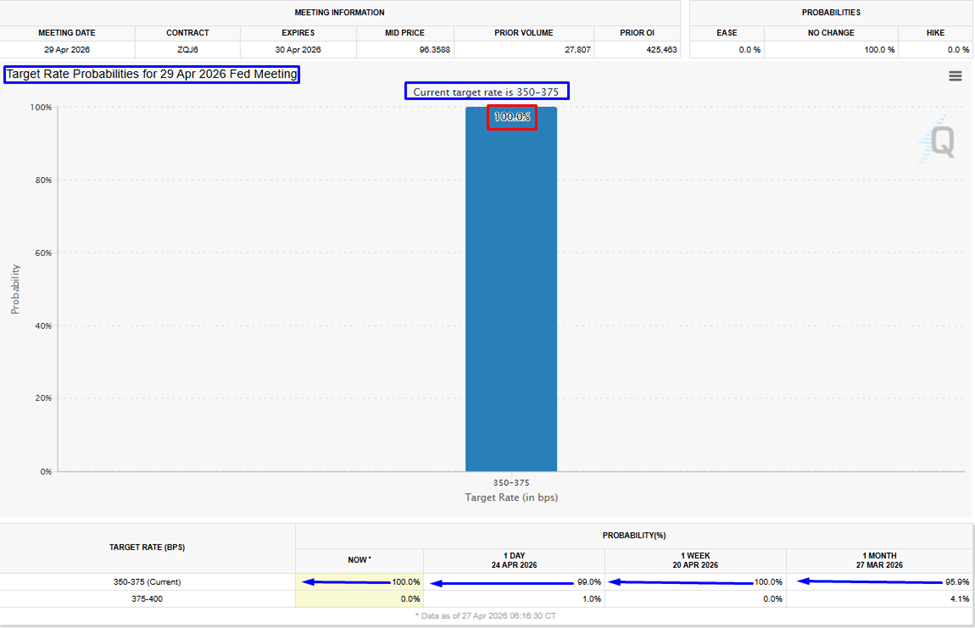
- CME FedWatch April no rate change probabilities have moved higher to 100% now from 95.7% on March 27, 2026.
Fed rate probability
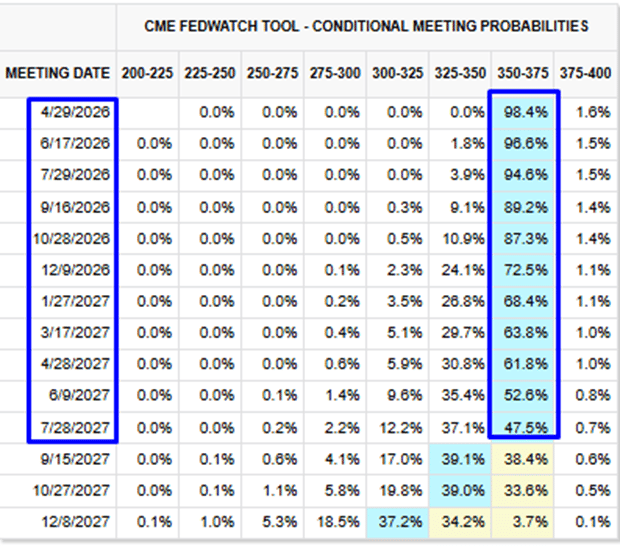
As of April 10, 2026
As of Today
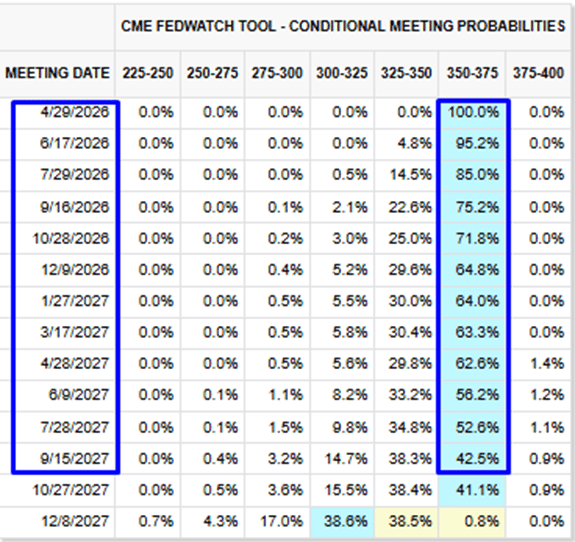
- CME FedWatch latest Fed rate probability points at no rate cut until mid-2027.
Technical Analysis Perspective:
Gold/US Dollar
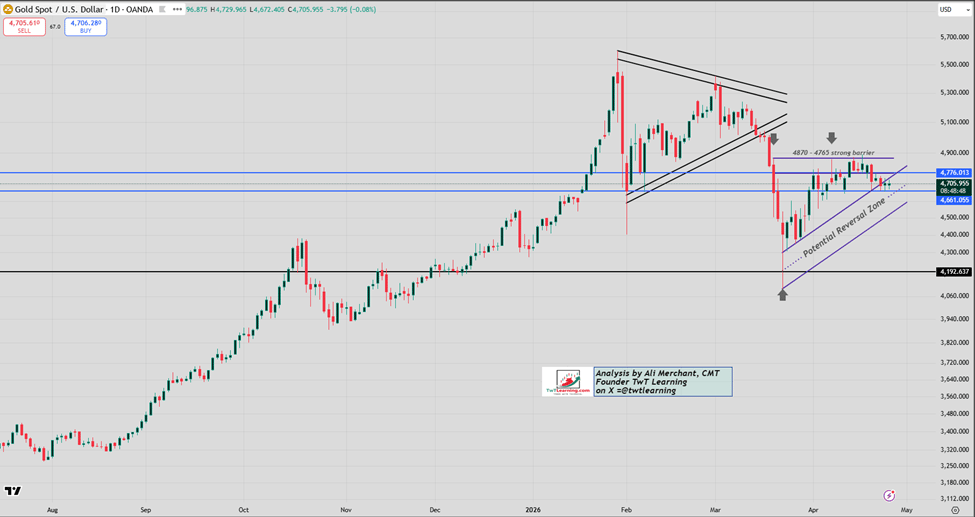
- Spot gold is trading within a potential reversal zone between 4,640 and 4,530.
- Price may stay in a tight range of 4,775–4,655 for days to weeks before a clear direction emerges.
- Gold has shown coiling action since early April and should remain so until a decisive break above 4,775 or below 4,655.
- For now, expect range-bound trading.
Gold daily chart
GLD ETF:
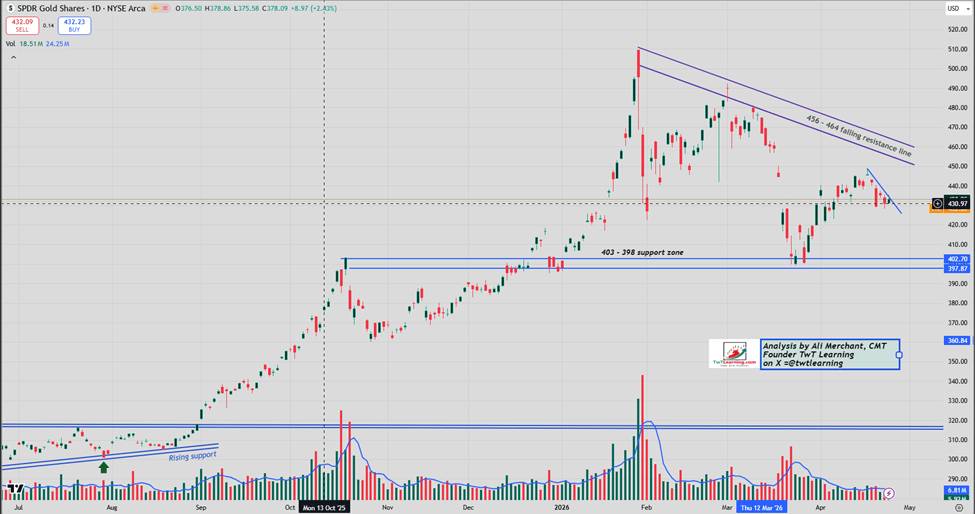
- GLD trading between a declining trendline from the Jan 29, 2026, high (509.70) and flat support around 403–398.
- Nearby falling trendline from the 448.70 high now intersects at 431.
- A daily open above 431 and hold of that base would target a rally to 445–448 in coming days.
- Failure to hold 431 would likely push price to 428, with further downside risk to 422.
GLD daily chart:
GLD Seasonality:
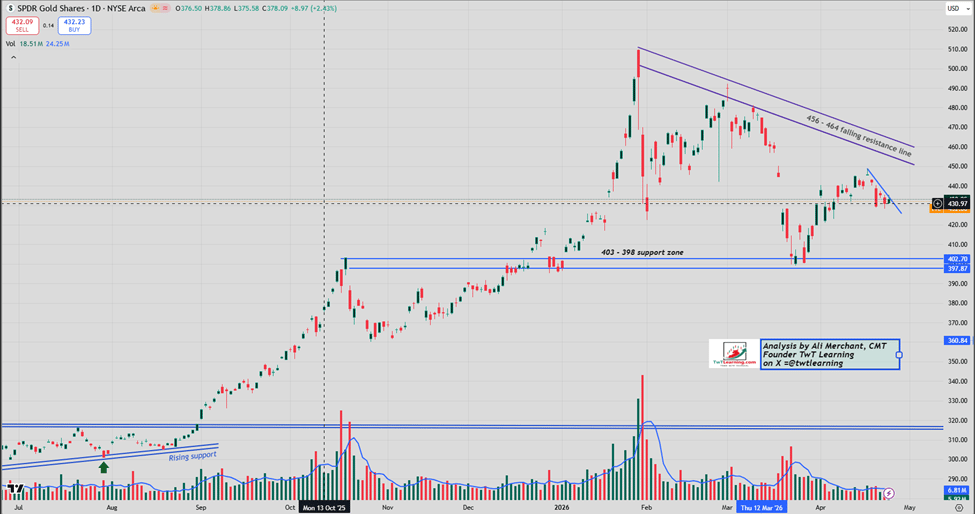
Since 2007, GLD has posted an April gain of 1.30% in 60% of the years, while May has seen a decline of 0.18% in 42% of the years.
Author

Ali Merchant, CMT
TwT Learning
Ali Merchant is a seasoned financial market professional with expertise in Technical Analysis, Treasury & Capital Markets, Trading, Sales, Research, Training, & Fund Management, He has been trading FX, FX options, US stocks & opti
















