Gold: Short-term pressure and long-term bullish outlook

The gold market has always been a focal point for investors seeking a hedge against economic uncertainty and inflation. As we navigate through 2024, the market dynamics present a mixed picture: a short-term bearish outlook due to seasonal corrections juxtaposed with a robust long-term bullish trend. Historically, June has been a challenging month for gold, often marked by price corrections. This seasonal tendency appears to be reasserting itself in 2024, potentially putting pressure on gold prices in the near term. However, these short-term fluctuations should not overshadow the underlying bullish trend that has been developing over the past several years.
Long-term Gold breakout
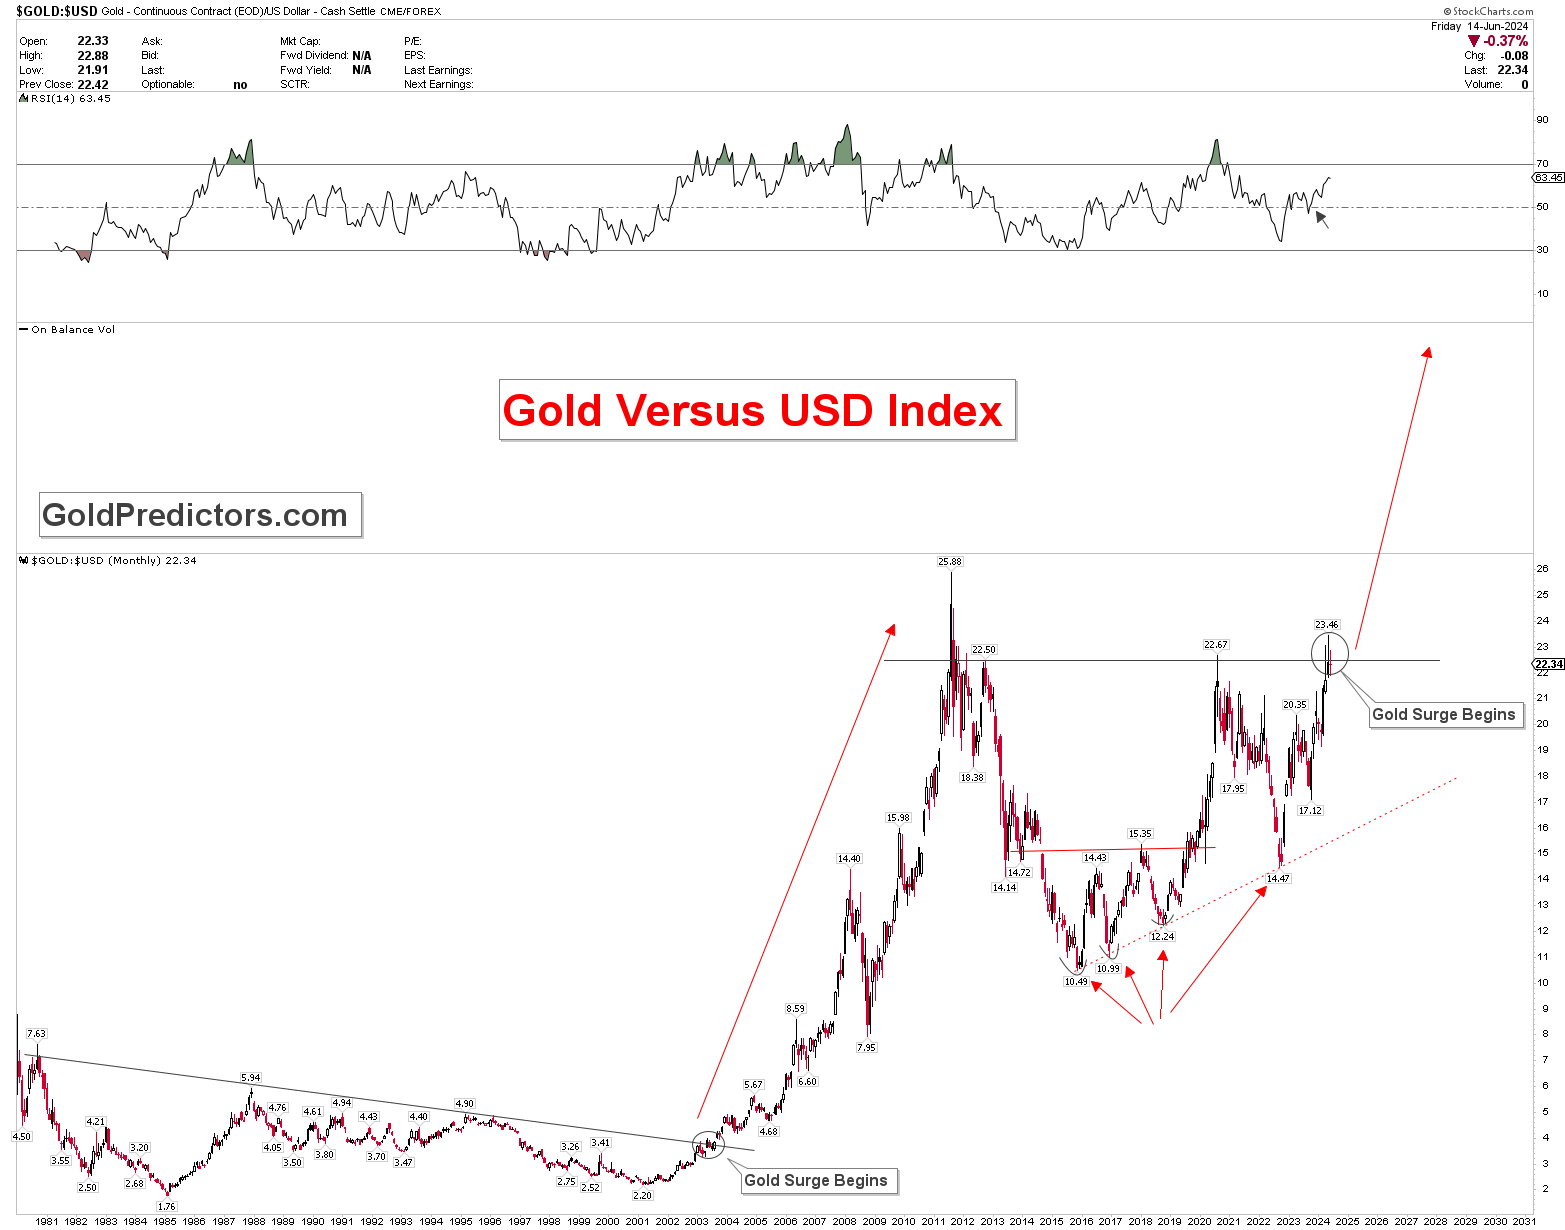
In 2024, gold already broke through a significant long-term pivot at $2075 in the spot gold market, signalling a strong bullish phase. This breakout is further validated by the USD Index to gold ratio, which has exhibited a decisive breakout from a triangle formation. Historical patterns reinforce this bullish outlook. For instance, from 1970 to 1980, the gold market experienced a substantial rally during which the USD/Gold ratio plummeted. Similarly, the early 2000s saw another surge in gold prices, coinciding with a significant drop in this ratio, as shown in the chart below.
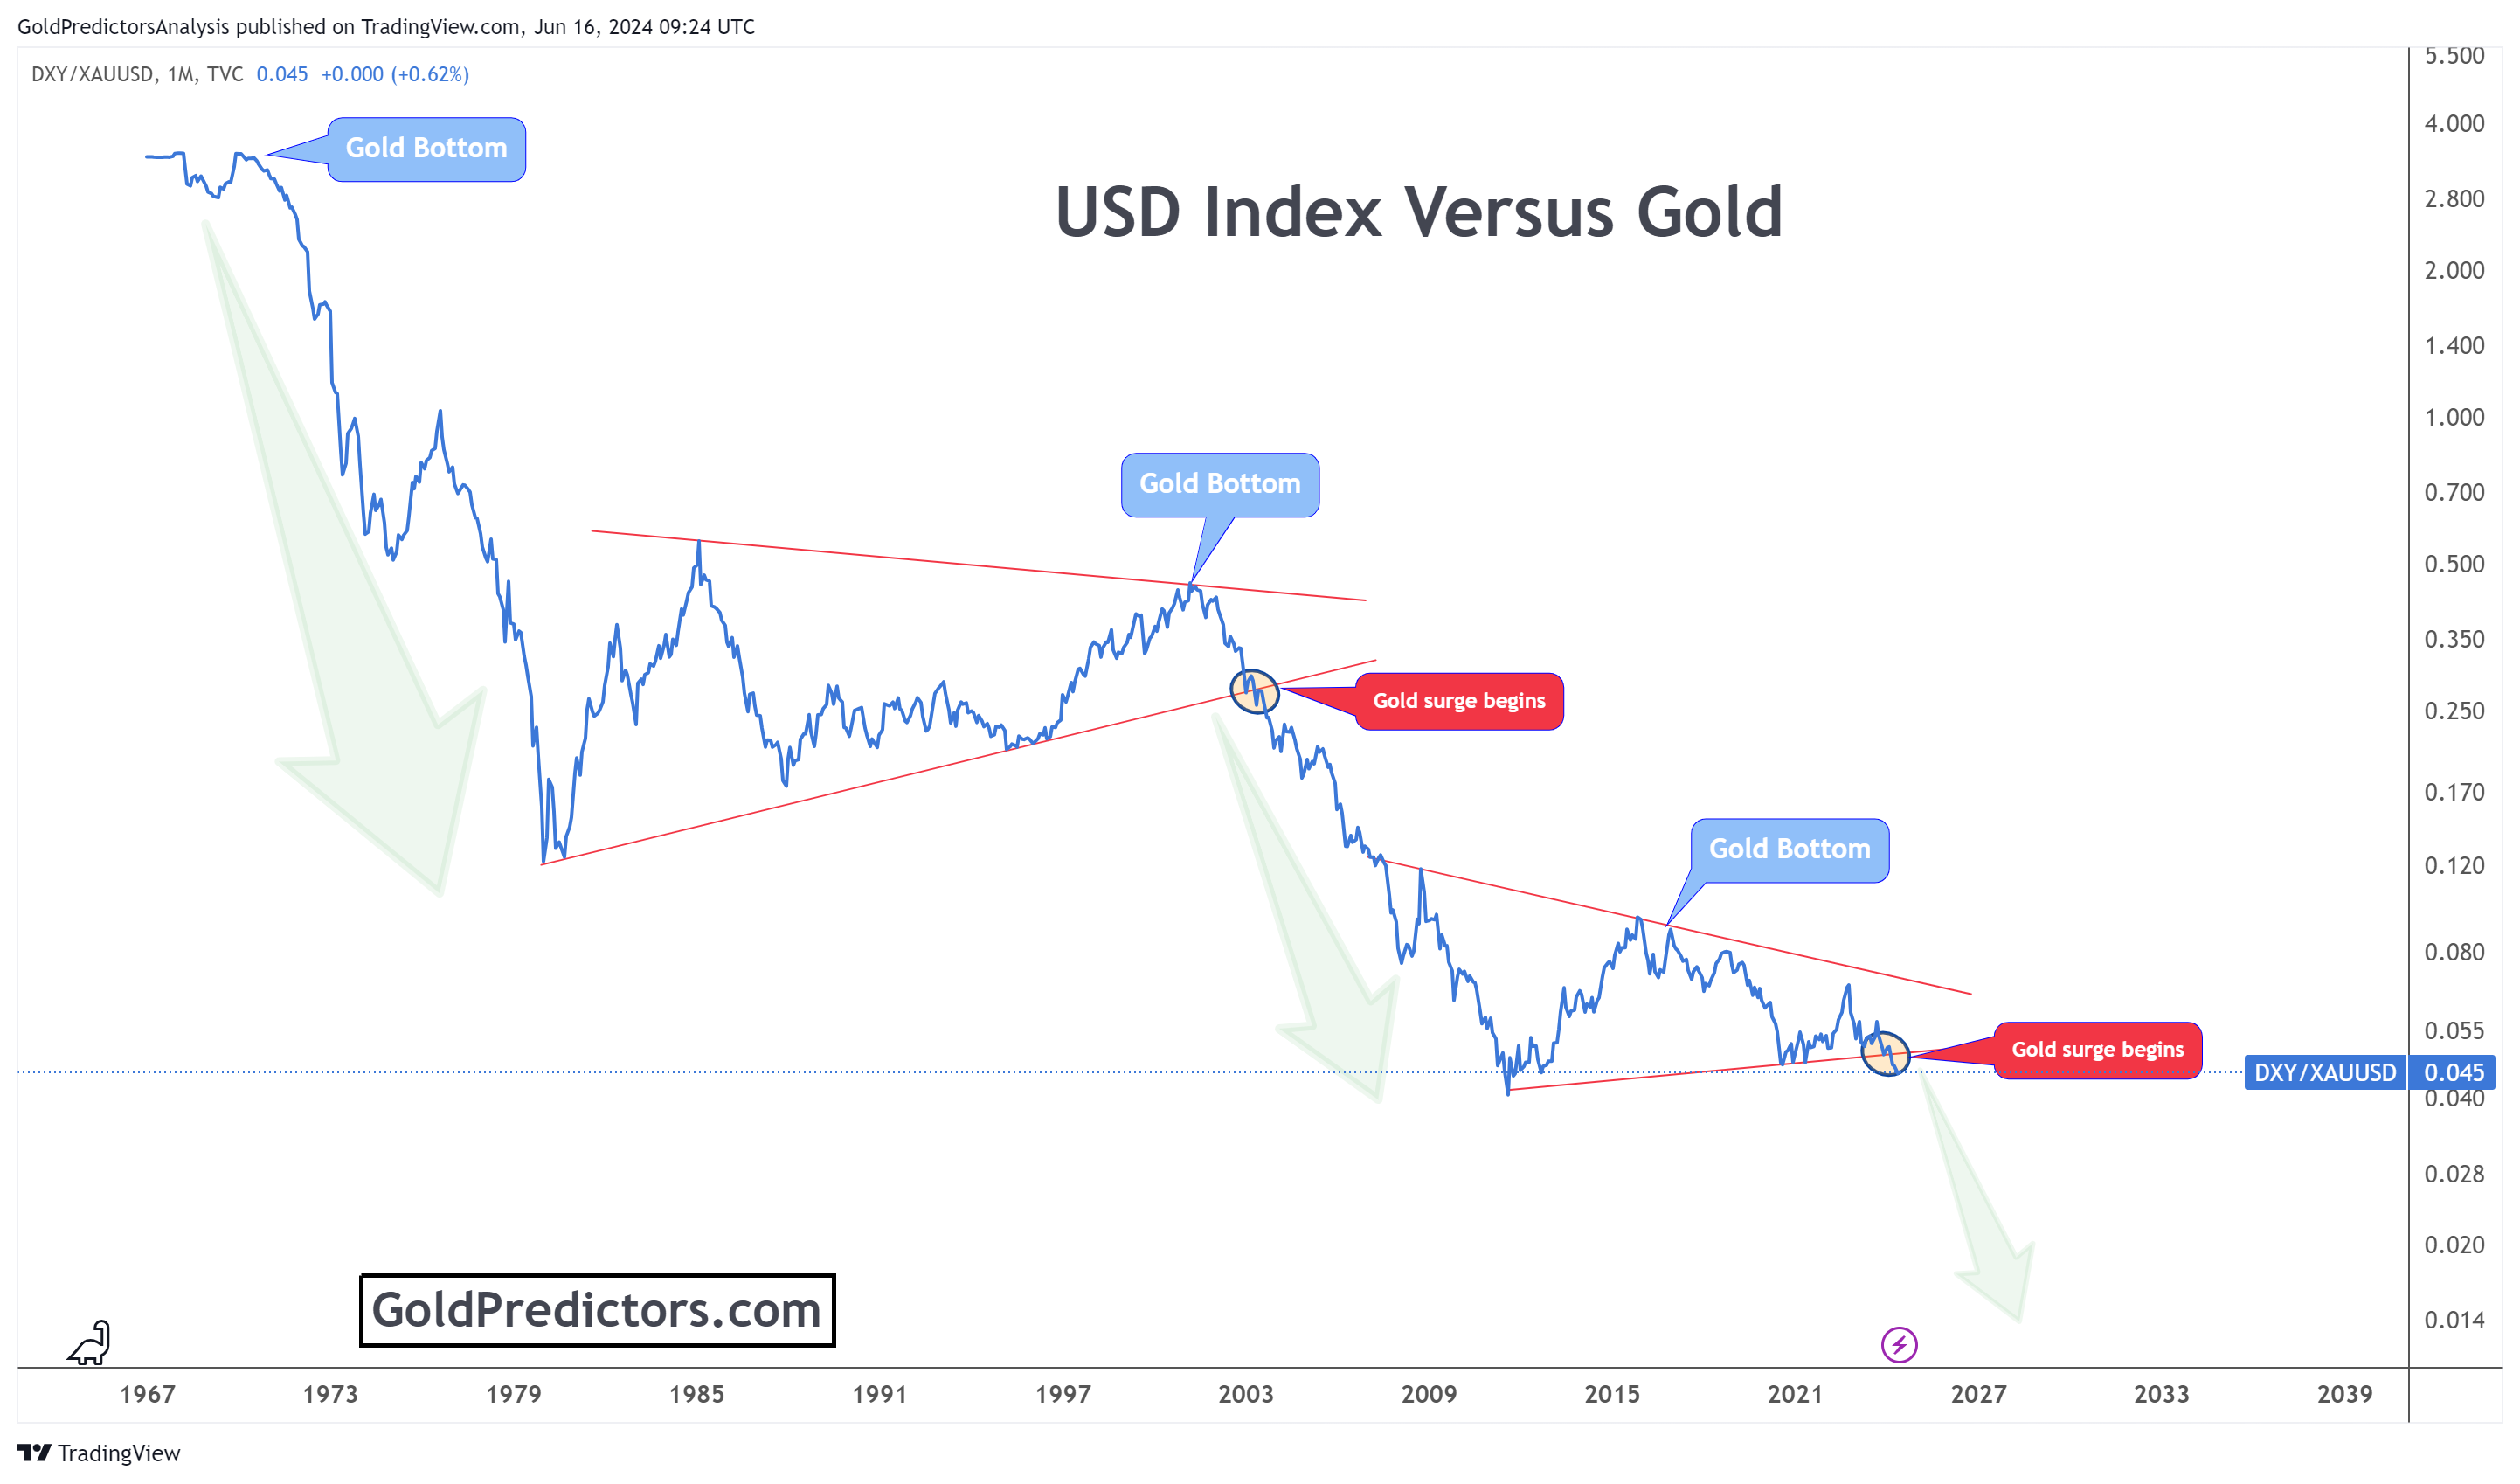
The ratio's recent behaviour confirms the ongoing bull phase, which commenced around 2016. The ratio's top formation at the edge of the triangle, followed by its breakout, suggests that gold is poised for another strong upward movement, likely to outperform the USD Index. This trend indicates that the next wave higher for gold has already begun, with the ratio of gold to the USD breaking from a pivotal area, forming a bullish price structure, as shown in the chart below.
While the long-term outlook remains positive, the current market scenario advises caution for short-term traders. The seasonal correction in June presents a bearish short-term outlook, which should be viewed as a strategic buying opportunity for long-term investors rather than a deterrent. Historical data and chart patterns support the notion that any price correction during this period will likely be temporary and should be leveraged to accumulate positions in gold.
This week's economic data will be crucial in shaping market sentiment. Investors will closely monitor the retail sales data from the United States, scheduled for release on Tuesday. Expectations are for a modest increase of 0.2% in May, up from the previous reading of 0%. Additionally, the release of May's Industrial Production and Capacity Utilization data will provide further insights into the health of the US economy and potential implications for the gold market.
Bottom line
In conclusion, while the gold market may face short-term headwinds due to seasonal corrections, the long-term outlook remains bullish. Historical patterns, technical breakouts, and supportive economic indicators all indicate a continued rally in gold prices in 2024. Investors should consider price corrections as buying opportunities, positioning themselves for potential gains as gold continues to outperform the USD Index.
Unlock exclusive gold and silver trading signals and updates that most investors don’t see. Join our free newsletter now!
Unlock exclusive gold and silver trading signals and updates that most investors don’t see. Join our free newsletter now!
Author

Muhammad Umair, PhD
Gold Predictors
Muhammad Umair is a financial markets analyst and investor who focuses on the forex and precious metals markets.


