|

Gold resumes decline, Elliott Wave bearish sequence targets $3400 [Video]

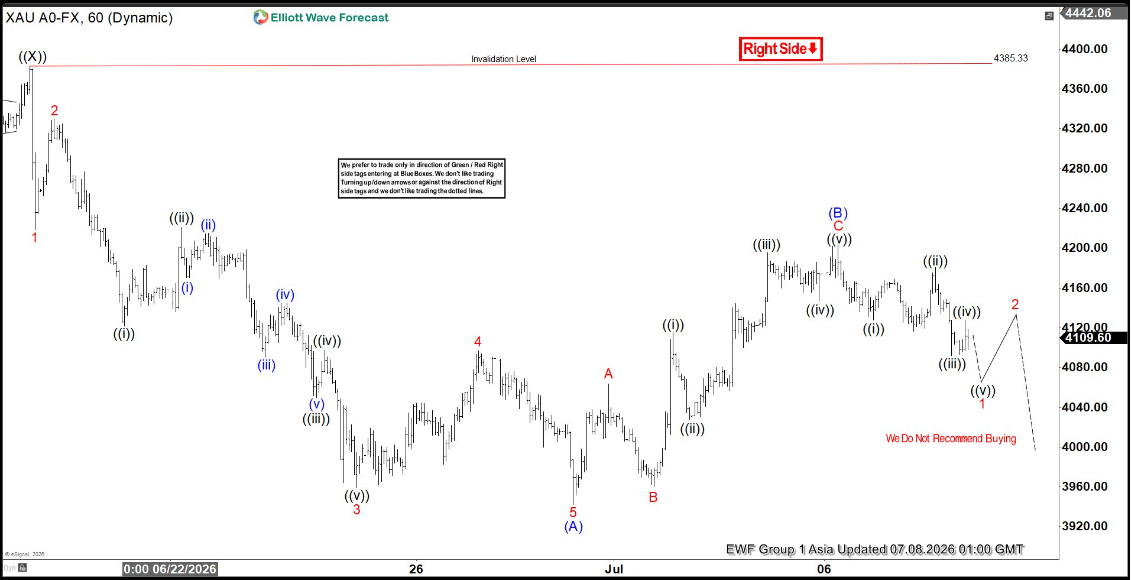
Spot Gold continues to exhibit an incomplete bearish sequence from the January 29 peak, with potential downside extending toward the $3400 area. The decline from the April 17 peak is unfolding as a double three Elliott Wave structure. Within this formation, wave ((W)) concluded at $4023.1, while wave ((X)) terminated at $4382.45. The market has since entered wave ((Y)), which is progressing as a zigzag. In this subdivision, wave (A) ended at $3942.43, and wave (B) completed at $4203.26, as illustrated in the one‑hour chart.

The yellow metal has now turned lower in wave (C), which is expected to subdivide into five waves. From below wave (B), the initial decline in wave 1 ended at $4021.52. A corrective rally in wave 2 is currently in progress, retracing the cycle from the July 6, 2026 peak before the broader decline resumes. The structure suggests that the corrective phase will remain limited as long as the pivot at $4203.26 holds. Under this condition, rallies are anticipated to fail in either three or seven swings, reinforcing the bearish outlook.

The broader implication is that the incomplete sequence from January continues to favor additional weakness. The technical framework highlights the potential for sustained downside pressure, with the $3400 region serving as a key target if the bearish cycle extends without truncation.

Gold 60-minute Elliott Wave chart
Gold Elliott Wave [Video]
Youtube preview

Author

Elliott Wave Forecast Team

Elliott Wave Forecast Team

ElliottWave-Forecast.com

More from Elliott Wave Forecast Team
Share:

Editor's Picks

GBP/USD strengthens to near 1.3400 as UK political risk fades

The GBP/USD pair gathers strength near 1.3395 during the Asian trading hours on Thursday, bolstered by fading domestic political uncertainty. However, hawkish minutes from the Federal Reserve and renewed tensions between the US and Iran might support the US Dollar and cap the upside for the major pair.


EUR/USD sticks to positive bias above 1.1400 vs USD; Mideast tensions cap gains

The EUR/USD pair attracts some buyers for the second straight day, though it lacks follow-through and remains confined within the previous day's range during the Asian session on Thursday. Spot prices currently trade around the 1.1420 area, up less than 0.10% for the day, and remain at the mercy of the US Dollar price dynamics.

Gold sees more pain as Iran tensions revive inflation fears

Gold price reflects signs of softness on Thursday, trading 0.5% lower at around $4,056 during the Asian trading session. The precious metal is under pressure as Middle East hostilities have revived fears of high global inflation, a scenario that discourages major central banks from easing monetary conditions. This framework bodes well for interest-bearing assets, but diminishes the appeal of non-yielding assets, such as Gold.


Bitcoin eyes $60,000 – Jupiter and Pi Network lead losses

Bitcoin is extending its losses on Thursday for the third consecutive day amid renewed tensions between the US and Iran. Risk-off market sentiment intensifies, with Jupiter and Pi Network emerging as the biggest losers over the last 24 hours. CoinMarketCap's Crypto Fear and Greed Index is at 26 on Thursday, down from 29 on Monday, indicating a clear increase in risk-off sentiment.

2.50%: Why the Kiwi's first hike in three years is a wager on a number nobody can see
The Reserve Bank of New Zealand (RBNZ) raised the Official Cash Rate (OCR) by 25 basis points to 2.50% at 02:00 GMT on Wednesday, its first hike in three years and the moment the bank that cut deeper than any G10 peer last cycle turned to face the other way.
Bye, forward guidance: How to trade when central banks choose silence

Central banks have spent years telling markets what might come next. Now, traders face the possibility that they say a lot less. From the Federal Reserve to the European Central Bank and the Bank of England, policymakers are pushing back against forward guidance.