Gold pulls below 1,800, EUR/USD retreats below 1.0200

Gold pulls below 1,800, bias still neutral
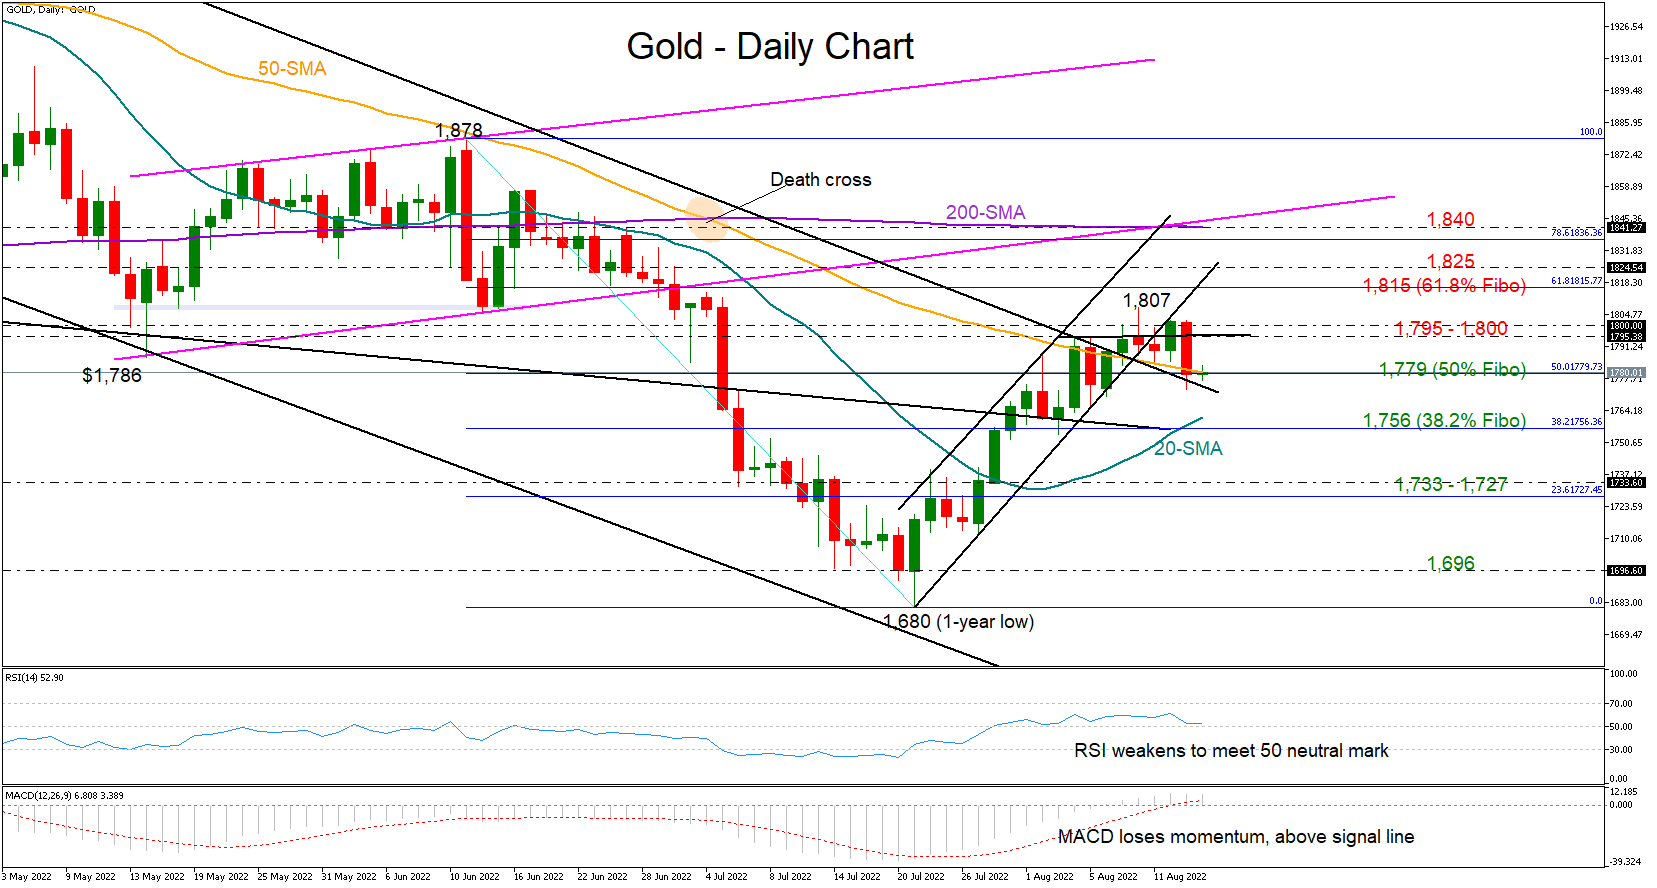
Gold started the week on the wrong foot, sliding to a low of 1,772 on Monday after two days of unsuccessful efforts to claim the 1,800 psychological mark.
The bearish correction, however, has not raised alarms yet, as the price seems to be setting a foothold around the broken bearish channel from March and the 50-day simple moving average (SMA) at 1,779. The 50% Fibonacci retracement of the 1,878 – 1,680 is also cementing that base. Moreover, the RSI, although weaker, is marginally above its 50 neutral mark and the MACD keeps fluctuating above its red signal line despite recently losing momentum, suggesting a neutral bias instead.
If that floor cracks, the precious metal may seek support somewhere between the 20-day SMA and the 38.2% Fibonacci of 1,756. Lower, the sell-off could accelerate towards the 1,733 – 1,727 constraining zone, a break of which could trigger another significant decline towards the bottom of $1,696 - $1,680.
Otherwise, a bounce on 1,779 may again push for a close above the nearby ceiling of 1,795 - 1,800. Should the bulls succeed this time, the next obstacle could develop within the 1,815 - 1,825 region, while not far above, the flattening 200-day SMA around 1,840 could be a more important resistance.
In brief, gold has not flipped back to a bearish bias despite its latest pullback. For that to happen, the price will need to breach the 1,779 base.
EUR/USD retreats below 1.0200 and short-term SMAs
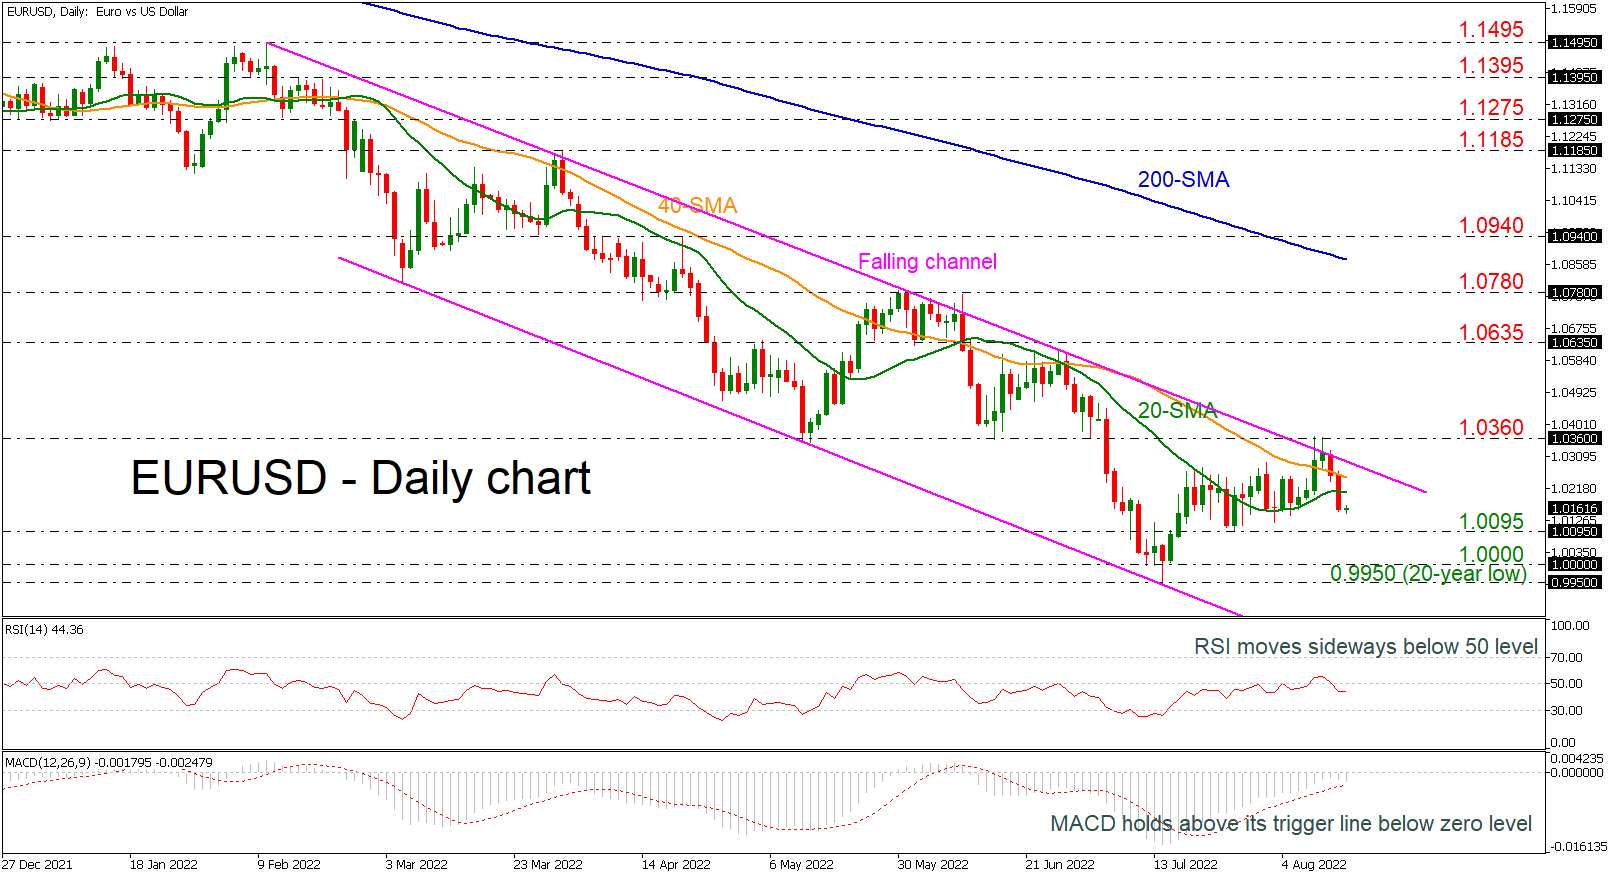
EURUSD has reversed back down again after finding resistance at the 1.0360 barrier and the descending trend line. Also, the pair retreated beneath the 20- and 40-day simple moving averages (SMAs) with the technical indicators suggesting a neutral to negative bias in the short-term. The RSI is holding just below the neutral threshold of 50, while the MACD is trying to strengthen its negative momentum below the zero level.
Further losses should see the 1.0095 level, acting as a major support ahead of the parity level and the 20-year low of 0.9950. A drop below these lines would reinforce the bearish structure in the long-term and open the way towards the next key support of 0.9608, registered in August 2002.
In the event of an upside reversal, the 20- and 40-day SMAs at 1.0210 and 1.0255 respectively could be the next resistance levels to have in mind ahead of the downtrend line and the 1.0360 hurdle. A break above this level would shift the short-term view to a more bullish one as it would take the pair towards the 1.0635 resistance.
All in all, EURUSD has been developing within a downward sloping channel since February and only an advance beyond the 1.0360 barrier may change the outlook to neutral. Currently, the pair is still in a strong negative mode in the long-term.
Author

Christina joined Trading Point in May 2017. She holds a master degree in Economics and Business from the Erasmus University Rotterdam with a specialization in International economics.