Cardano Price Forecast: Bulls eye a second leg higher as whales buy
- Cardano trades above $0.196 on Monday after a double-digit surge in the previous two weeks.
- Santiment data shows whale wallets accumulating ADA, signaling growing demand.
- Derivatives metrics show mixed sentiment with a slight bullish tilt, suggesting upside momentum could build further.

Cardano (ADA) trades above $0.196 at the start of the week on Monday after posting double-digit gains over the past two weeks. ADA’s bullish price action is supported by steady whale accumulation. Meanwhile, derivatives sentiment is showing a slight bullish tilt, suggesting a second leg higher for ADA.
Whales continue to accumulate
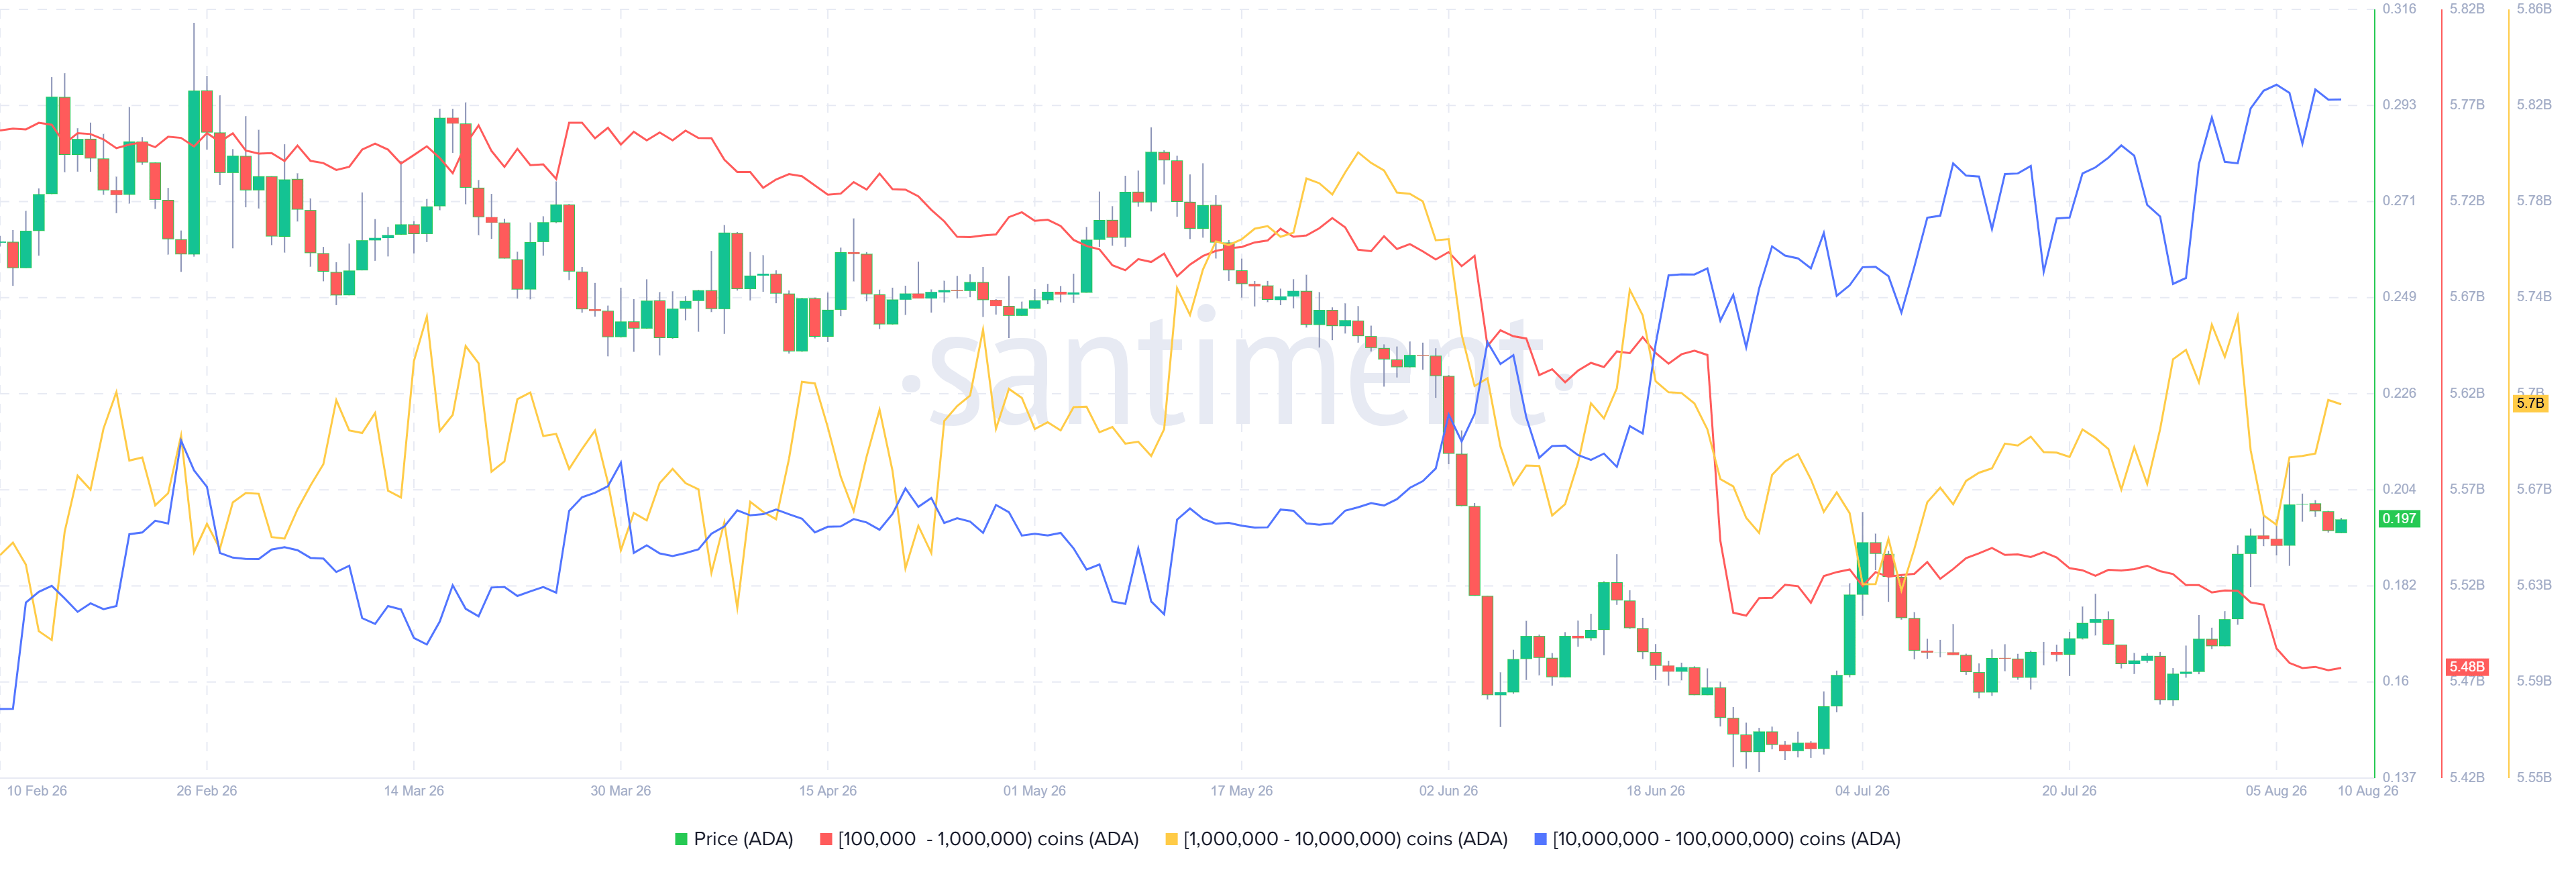
Santiment’s Supply Distribution data shows that large-wallet holders (whales) are steadily buying ADA, a move that supports the positive outlook for the token.
The metric indicates that whales holding between 1 million and 10 million ADA tokens (yellow line) and 10 million and 100 million ADA tokens (blue line) have accumulated a total of 110 million ADA tokens since Friday. This buy-the-dip scenario signals continued long-term interest among large-wallet holders and supports the ongoing price rally.
Derivatives metrics show a slight bullish tilt
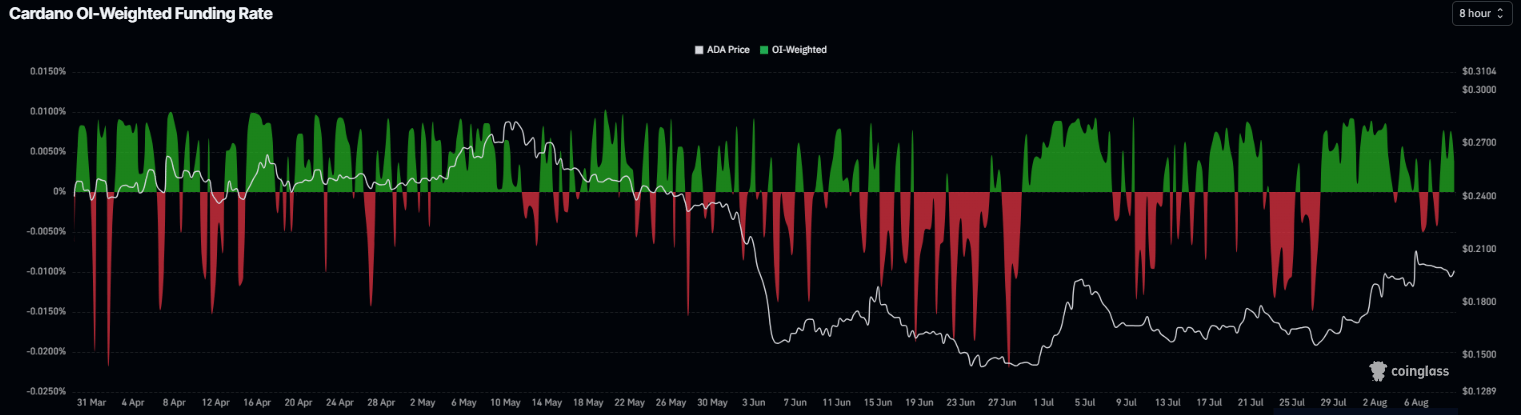
Cardano’s derivatives metrics show strengthening conditions. CoinGlass’ OI-Weighted Funding Rate data for ADA flipped positive on Saturday, reading 0.0038% on Monday. This positive rate indicates that longs are paying shorts and projects a bullish sentiment.
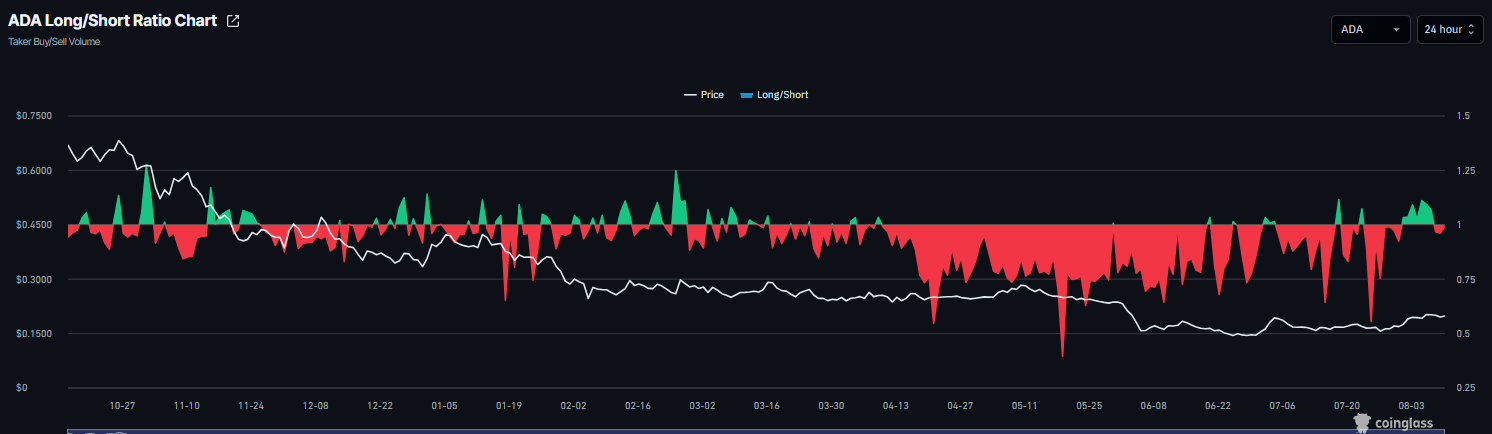
Meanwhile, Cardano’s long-to-short ratio is moving toward the neutral 1 level, reading 0.99 on Monday, suggesting that bearish sentiment is fading. A reading above 1 would indicate that long positions outnumber short positions, signaling a shift toward bullish sentiment.
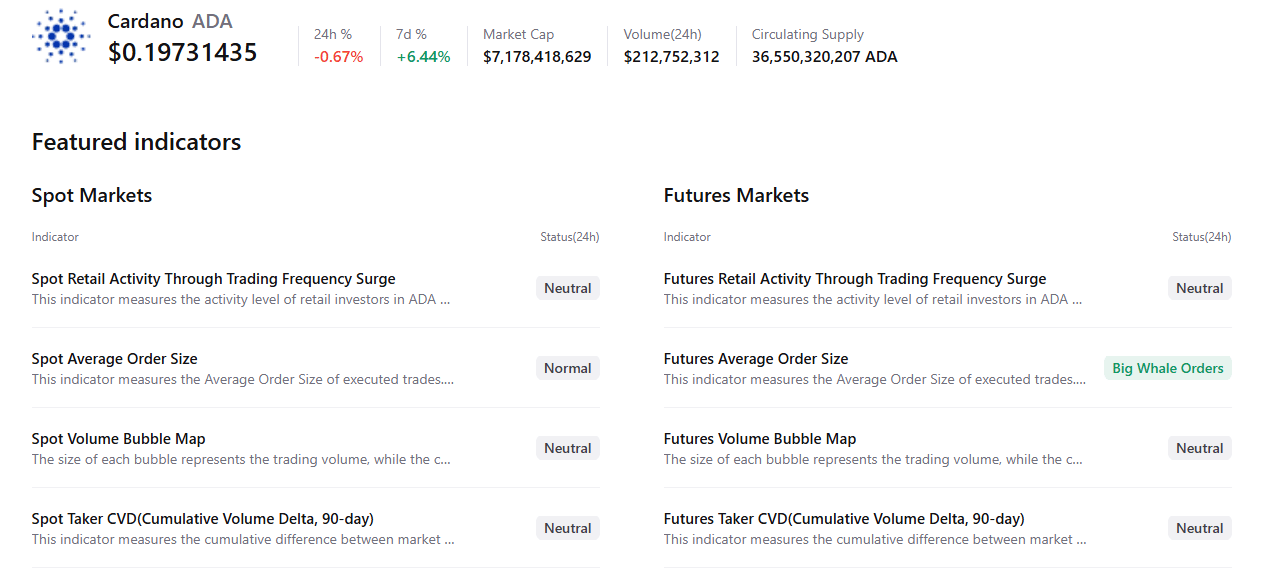
CryptoQuant’s summary data also shows a mild bullish tilt. Cardano’s futures markets show large whale orders with neutral conditions in other metrics, supporting a potential upside.
Cardano technical outlook: Bulls hold key support zone
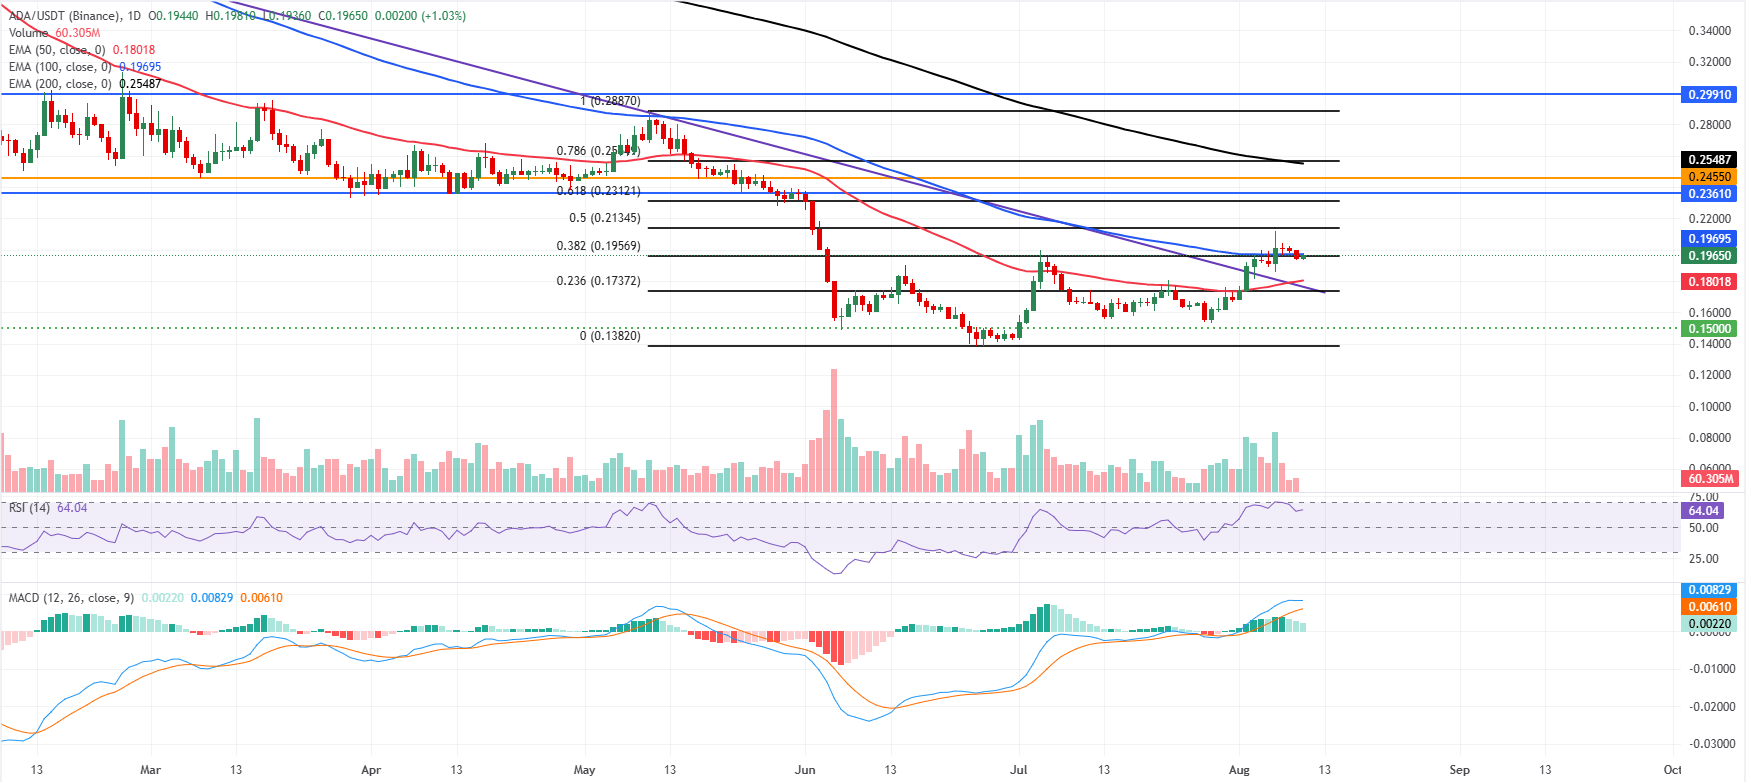
Cardano price trades at $0.196 on Monday, keeping a mild positive near-term tone as price holds above the 50-day Exponential Moving Average (EMA) at $0.180. However, it remains below the 100-day EMA at $0.196 and the 200-day EMA at $0.254.
The reclaim of the 38.2% Fibonacci retracement at $0.195 and the break above the downward trendline trigger at $0.176 hint at a developing recovery, while a firm Relative Strength Index (RSI) around 64 and a positive Moving Average Convergence Divergence (MACD) reading reinforce improving bullish momentum despite the broader overhead supply.
On the topside, immediate resistance is located at the 100-day EMA around $0.196, followed by the 50% retracement at $0.213 and the 61.8% Fibonacci retracement level near $0.231, with additional barriers at the horizontal cap of $0.236 come into play; a sustained break above this cluster would be needed to ease the broader bearish structure and expose the higher horizontal hurdle at $0.2991.
On the downside, initial support is seen at the 38.2% Fibonacci retracement around $0.195, ahead of the 50-day EMA at $0.180 and the former trendline break area near $0.176. In comparison, deeper losses would bring the 23.6% Fibonacci retracement at $0.173 and the horizontal floor at $0.150 into focus.
(The technical analysis of this story was written with the help of an AI tool. Know more.)
Author

Manish Chhetri
FXStreet
Manish Chhetri is a crypto specialist with over four years of experience in the cryptocurrency industry.




