Gold Price Forecast: XAU/USD needs acceptance above $1,825 to confirm a triangle breakout
- Gold price consolidates after volatile trading above the $1,800 mark.
- Risk-off flows return and fuel a US Dollar bounce while US Treasury bond yields ease.
- Gold price to remain at the mercy of the United States data and risk trends.
- Gold price challenges the triangle hurdle at $1,825 but needs a daily close above it.

Gold price is treading water above the critical $1,800 mark in Wednesday’s trading so far. A rebound in the United States Dollar (USD) demand is limiting the bullish attempts, despite a retreat in the US Treasury bond yields across the curve.
United States Dollar recovers despite negative US Treasury bond yields
The US Dollar is attempting a comeback this Wednesday after starting the week on the wrong footing, as global sentiment sours amid resurfacing concerns over rising inflation. Risk-off flows seep back into the market, as Asian stocks track the Wall Street decline. Investors remain wary over China’s further reopening, which could drive pent-up demand, fueling inflationary pressures. The safe-haven flows are lending support to the US Dollar after a United States Official said that “the US government may impose new COVID-19 measures on travelers to the United States from China over concerns about the "lack of transparent data" coming from Beijing.
In addition, reports that Chinese hospitals were under intense pressure amid the continued surge of COVID-19 infections dented appetite for riskier assets, allowing the US Dollar to stabilize at the expense of the Gold price. China remains on course for a complete transition from its zero-Covid policy, with the country re-opening its borders from January 8.
United States Housing data in focus
After the United States Housing Price Index and Goods Trade Balance data failed to lift the US Dollar a day before, all eyes turn toward the mid-tier US Pending Home Sales data. The United States Pending Home Sales plunged 37% YoY in October and are seen eroding another 36.7% of their value in November. The turmoil in the US housing market is likely to attract the US Federal Reserve’s (Fed) attention sooner (than later), as industry experts a potential recession in the US economy in the second half of 2023.
Renewed inflationary and recession fears could offer additional legs to the US Dollar recovery while the sentiment around the US Treasury bond yields could also play a spoilsport for Gold buyers. On Tuesday, a spike in the US Treasury yields across the curve dragged Gold price sharply lower from six-months highs of $1,833, as it settled the day around $1,813. At the time of writing, the benchmark 10-year United States Treasury bond yields are down 0.30% on the day, trading near 3.85%.
Gold price technical analysis: Daily chart
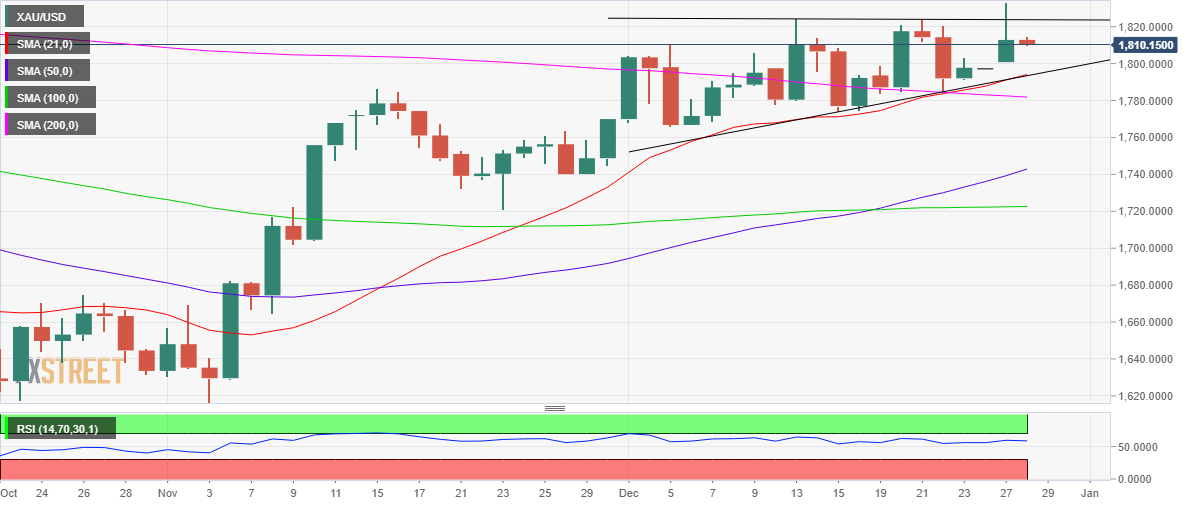
Technically, risks remain tilted to the upside for the Gold price as it continues to wave within an ascending triangle formation, having briefly captured the horizontal trendline resistance at $1,825.
Gold bulls need a daily closing above the latter to validate an upside break for the ascending triangle, opening doors for a retest of the multi-month high at $1,833. Further up, the psychological $1,850 level will come into the picture.
The bullish 14-day Relative Strength Index (RSI) and a bull cross confirmation continue to favor the upside for Gold price.
Shoud the pullback from higher levels extend, Gold price could revisit the previous day’s high at $1,800.
The next critical support awaits at $1,794, which is the confluence of the rising trendline (triangle support line) and the bullish 21-Daily Moving Average (DMA).
Daily closing below the latter will confirm the downside break from the triangle, invalidating the bullish thesis.
Author

Dhwani Mehta
FXStreet
Residing in Mumbai (India), Dhwani is a Senior Analyst and Manager of the Asian session at FXStreet. She has over 10 years of experience in analyzing and covering the global financial markets, with specialization in Forex and commodities markets.















