Gold Price Forecast: XAU/USD bulls need to crack $1,924 to confirm a falling wedge
- Gold price treads water around $1,920 on US Independence Day.
- US Dollar finds support from firmer US Treasury bond yields and a cautious risk tone.
- The daily technical setup suggests a limited upside for Gold price ahead of US jobs data.

Gold price trades around a flatline near $1,920 early Tuesday, having enjoyed good two-way price action on Monday before ending the day almost unchanged. Thin trading conditions are likely to extend during the day as the US markets are closed in observance of Independence Day.
Firmer US Treasury bond yields cap Gold price
On Monday, Gold price swung between gains and losses as traders remained on the sidelines in a long weekend break leading up to the July 4 Independence Day. A cautious mood prevailed as investors weighed the US Federal Reserve (Fed) rate hike prospects for this year, especially after the top-tier US ISM Manufacturing PMI data unexpectedly showed that contraction in the manufacturing sector is deepening further. The United States Dollar (USD) came under renewed selling pressure in an immediate reaction to the downbeat data, but quickly regained its footing as the ISM data rekindled US economic growth fears and dampened sentiment around US stocks.
US stocks ended a shortened day of trading with mixed results as traders erred on the side of caution on the first trading day of the second half of the year. The mixed market mood cushioned the downside in the safe-haven US Dollar while limiting the Gold price rebound. The sharp rebound in US Treasury bond yields on Monday took the wind out of the ongoing Gold price recovery. Markets continue to price about an 87% probability of a 25 basis-point (bps) interest-rate hike in July, according to CME Group’s Fedwatch tool, bringing rates into the 5.25%-5.50% range. Interest-rate cuts are seen on March 2024.
Looking ahead, Gold price is likely to maintain its range trade above $1,900, although it remains at risk of wild swings due to holiday-thinned market conditions. All eyes are on Wednesday’s Minutes of the Fed June meetings for clarity on the central bank’s rate hike path. US labor market data is also eagerly anticipated, with the ADP Employment Change and JOLTS job opening due this Thursday ahead of Friday’s all-important Nonfarm Payrolls release.
Gold price technical analysis: Daily chart
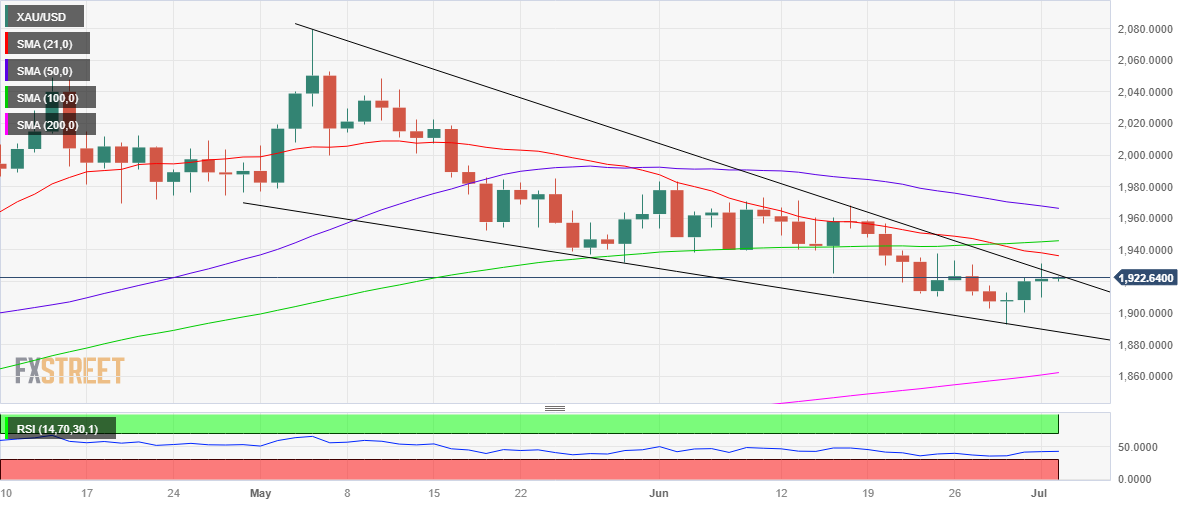
Despite the upside attempts, Gold price remains vulnerable, as portrayed by its daily technical setup. A Bear Cross and bearish Relative Strength Index (RSI) suggest that Gold price remains a ‘sell on bounce’ trade unless Gold buyers yield a sustained move above the downward-sloping 21-Daily Moving Average (DMA) at $1,936.
Ahead of that, critical falling trendline resistance at $1,924 could challenge bearish commitments, with a daily closing above the latter to confirm an upside break from a falling wedge formation. Gold price has been traversing within a falling wedge after topping out at record highs of $2,080 in early April.
The next relevant upside barrier is seen at the $1,930 round figure.
On the downside, immediate support awaits at the $1,900 threshold, below which the three-month low of $1,893 will be retested. The next target on Gold sellers’ radars is seen at the descending trendline at $1,890.
Premium
You have reached your limit of 3 free articles for this month.
Start your subscription and get access to all our original articles.
Author

Dhwani Mehta
FXStreet
Residing in Mumbai (India), Dhwani is a Senior Analyst and Manager of the Asian session at FXStreet. She has over 10 years of experience in analyzing and covering the global financial markets, with specialization in Forex and commodities markets.


