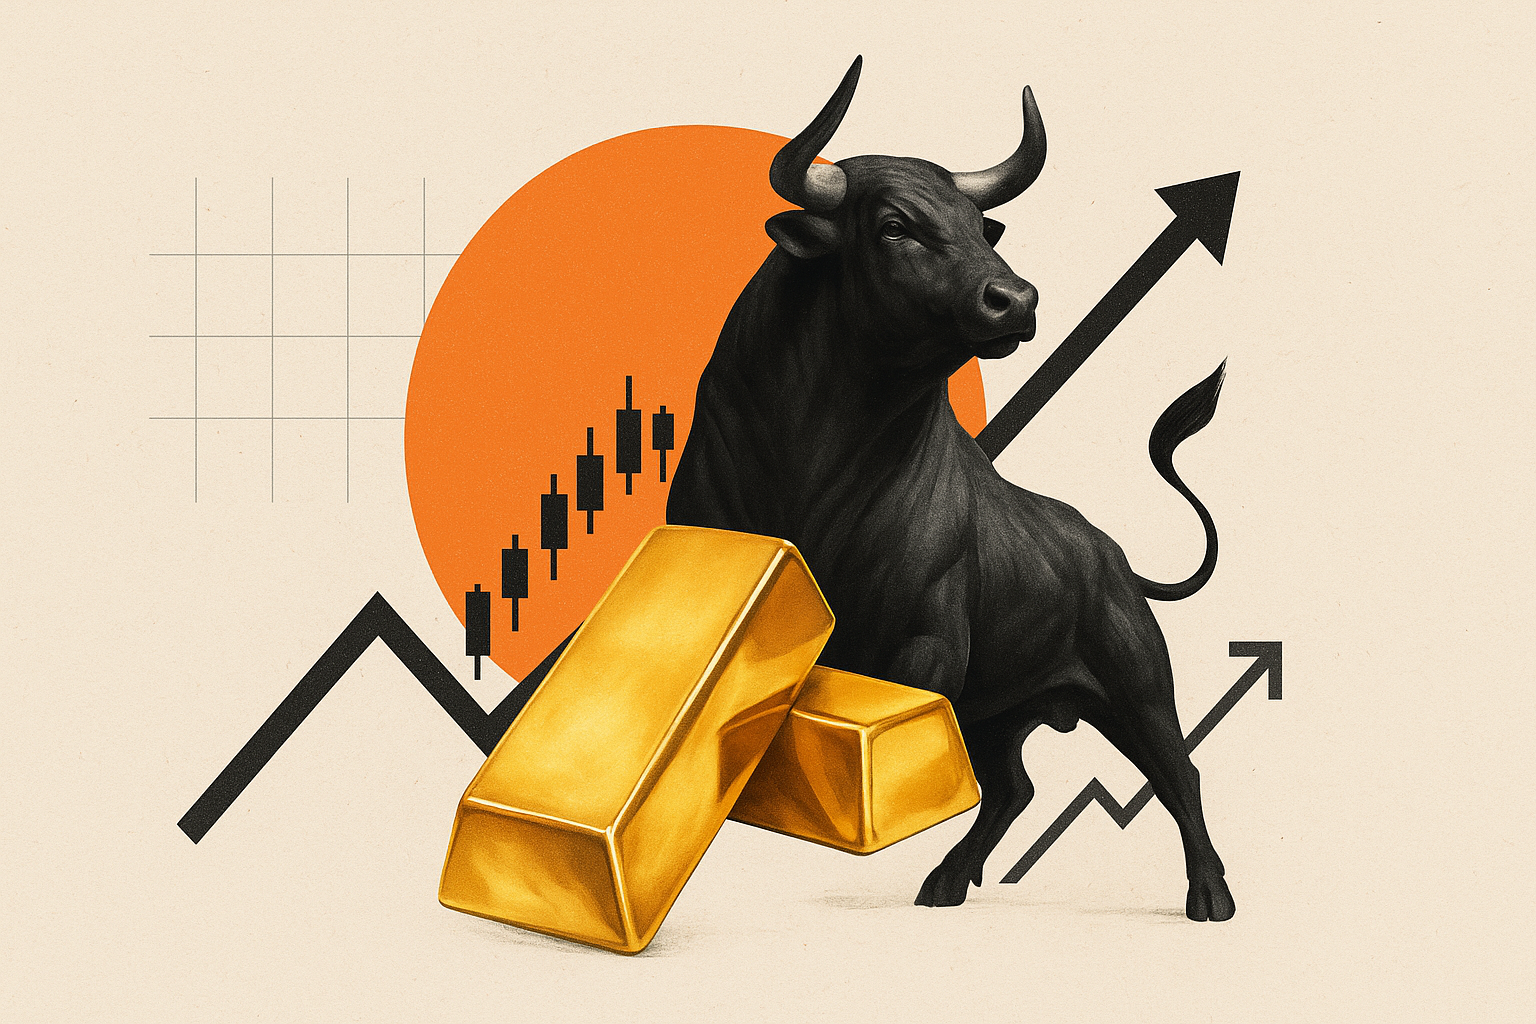
Gold Price Forecast: US-Iran peace deal bolsters XAU/USD recovery as eyes turn to Fed
- Gold extends its three-day recovery, surging nearly 3% on US-Iran peace deal optimism.
- The US Dollar holds losses amid diminishing safe-haven appeal and falling Oil prices.
- Technically, Gold needs to recapture the 200-day SMA at $4,454 to negate the near-term bearish outlook.
Gold is at its highest level in four days early Monday, above $4,300, extending the bullish opening gap and the recent recovery. The bright metal kicks off a new week with a bang, having hit year-to-date (YTD) lows near the $4,000 threshold last week.
Gold: Will buyers sustain control?
Finally, almost a four-month-long war between the United States (US) and Iran came to an end after both sides reached an initial peace deal on Sunday, which will come into effect on Friday, June 19.
US President Trump said that the agreement he reached with Iran would ultimately assure that the Strait of Hormuz is “permanently toll-free,” the New York Times reported on Sunday.
However, Trump said that if Iran failed to reach a final nuclear accord with the US, he would resume military strikes on Tehran or make the US “the guardian of the Middle East” in return for 20 percent of the region’s revenues.
Meanwhile, Iranian Deputy Foreign Minister Kazem Gharibabadi noted: “A permanent and immediate end to the war has been declared on all fronts, including Lebanon.”
Asian stocks jump through the roof, with risk flows dictating amid renewed geopolitical optimism. Traders are dumping the so-called safe-haven USD in search of higher returns, providing additional legs to the USD-denominated Gold price.
Additionally, Gold draws support from the slump in oil prices, following the agreement on the reopening of the Strait of Hormuz, helping alleviate inflationary concerns.
That could weigh on US Federal Reserve (Fed) interest rate hike bets and bode well for non-yielding assets such as the bright metal.
However, it remains to be seen whether Gold sustains its recovery momentum as many of the details of the deal remain unclear, especially around the reopening of the Strait of Hormuz.
Additionally, if Israel continues its aggression against Lebanon, it could threaten the peace agreement. Furthermore, traders could resort to repositioning their recent Gold longs before the all-important two-day Fed monetary policy meeting, starting Tuesday, the first one under new Chairman Kevin Warsh.
Gold’s technical setup on the daily chart also keeps the bearish bias in place in the near-term, leaving the bullion at risk of renewed downside.
Gold price technical analysis: Daily chart
In the daily chart, XAU/USD trades at $4,326.30, holding a bearish near-term bias as spot remains below the 21-day, 50-day, 100-day and 200-day simple moving averages (SMAs). The clustering of these SMAs well above price suggests rallies are corrective within a broader downside phase, while the Relative Strength Index (RSI) around 44 hints at only modest negative momentum rather than outright oversold conditions.
On the topside, initial resistance aligns with the 21-day SMA near $4,421, followed by the 200-day SMA around $4,454, where a recovery would likely face its first significant supply zone. Further up, the 50-day SMA at roughly $4,581 and the 100-day SMA near $4,762 form a higher resistance band that would need to be reclaimed to ease the prevailing bearish technical structure.
(The technical analysis of this story was written with the help of an AI tool.)
Gold FAQs
Gold has played a key role in human’s history as it has been widely used as a store of value and medium of exchange. Currently, apart from its shine and usage for jewelry, the precious metal is widely seen as a safe-haven asset, meaning that it is considered a good investment during turbulent times. Gold is also widely seen as a hedge against inflation and against depreciating currencies as it doesn’t rely on any specific issuer or government.
Central banks are the biggest Gold holders. In their aim to support their currencies in turbulent times, central banks tend to diversify their reserves and buy Gold to improve the perceived strength of the economy and the currency. High Gold reserves can be a source of trust for a country’s solvency. Central banks added 1,136 tonnes of Gold worth around $70 billion to their reserves in 2022, according to data from the World Gold Council. This is the highest yearly purchase since records began. Central banks from emerging economies such as China, India and Turkey are quickly increasing their Gold reserves.
Gold has an inverse correlation with the US Dollar and US Treasuries, which are both major reserve and safe-haven assets. When the Dollar depreciates, Gold tends to rise, enabling investors and central banks to diversify their assets in turbulent times. Gold is also inversely correlated with risk assets. A rally in the stock market tends to weaken Gold price, while sell-offs in riskier markets tend to favor the precious metal.
The price can move due to a wide range of factors. Geopolitical instability or fears of a deep recession can quickly make Gold price escalate due to its safe-haven status. As a yield-less asset, Gold tends to rise with lower interest rates, while higher cost of money usually weighs down on the yellow metal. Still, most moves depend on how the US Dollar (USD) behaves as the asset is priced in dollars (XAU/USD). A strong Dollar tends to keep the price of Gold controlled, whereas a weaker Dollar is likely to push Gold prices up.
Premium
You have reached your limit of 3 free articles for this month.
Start your subscription and get access to all our original articles.
Author

Dhwani Mehta
FXStreet
Residing in Mumbai (India), Dhwani is a Senior Analyst and Manager of the Asian session at FXStreet. She has over 10 years of experience in analyzing and covering the global financial markets, with specialization in Forex and commodities markets.