Gold price analysis: XAU/USD tests critical 4,000 barrier

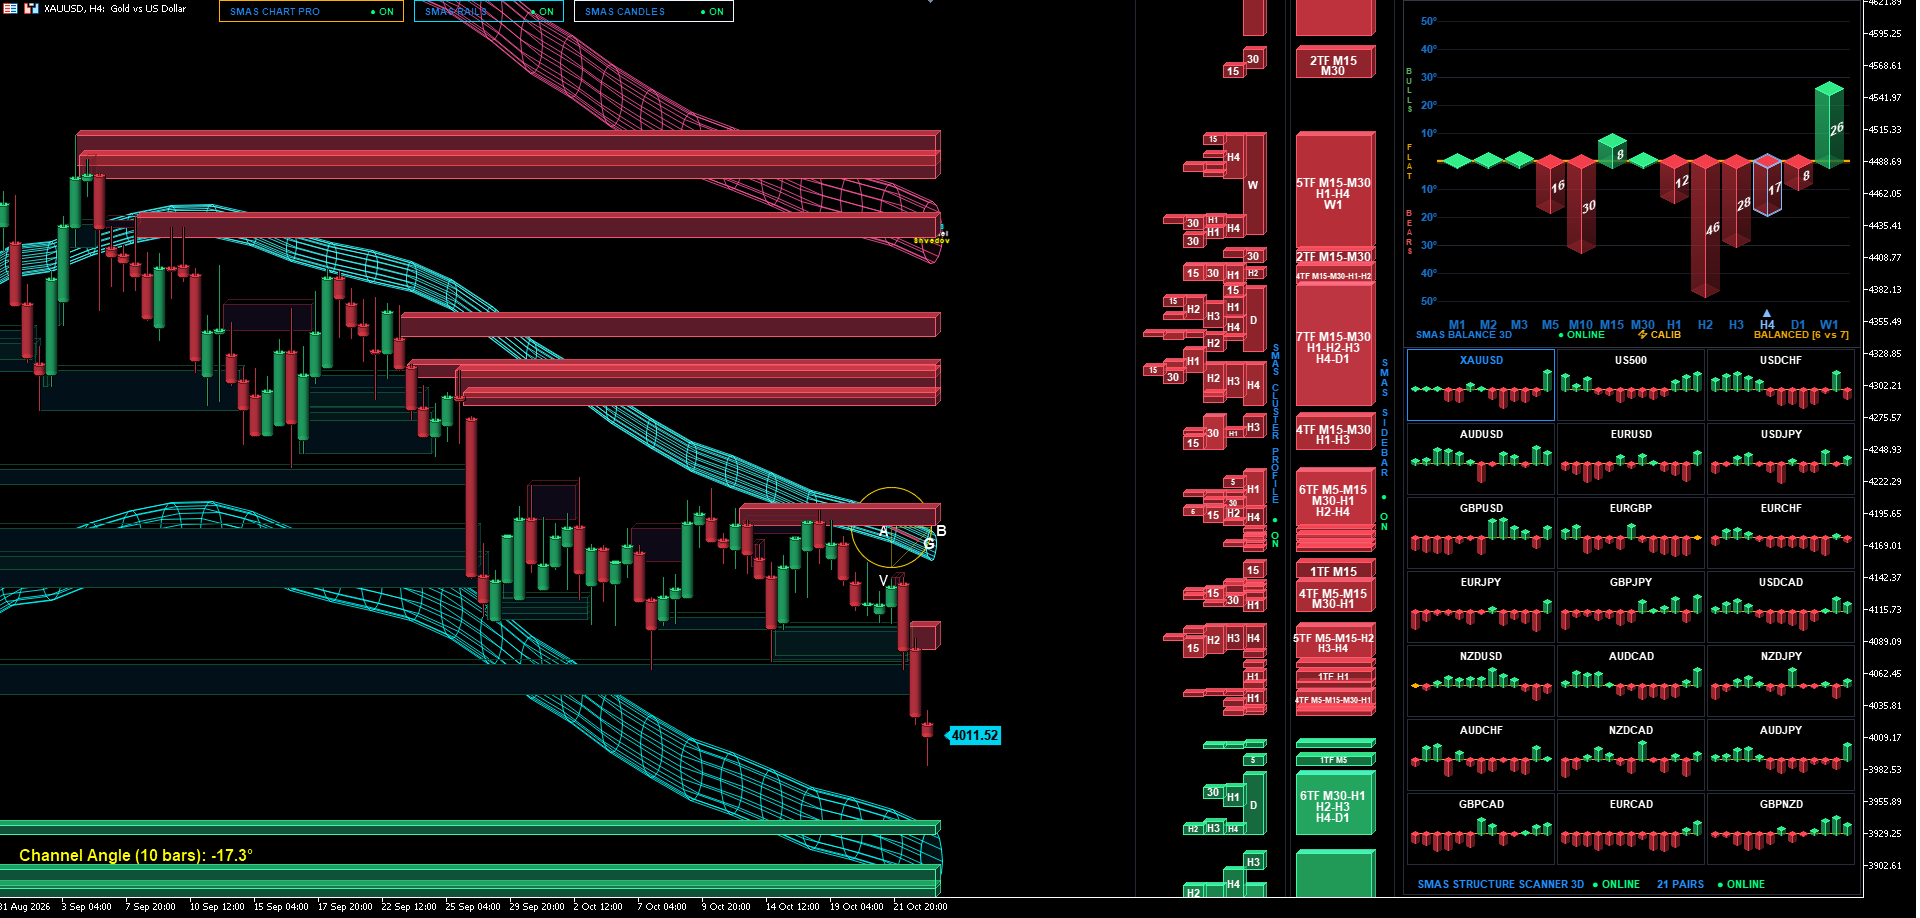
Gold (XAU/USD) tumbles to 4,011.52 within a persistent descending Structure Engine corridor (-17.3°).
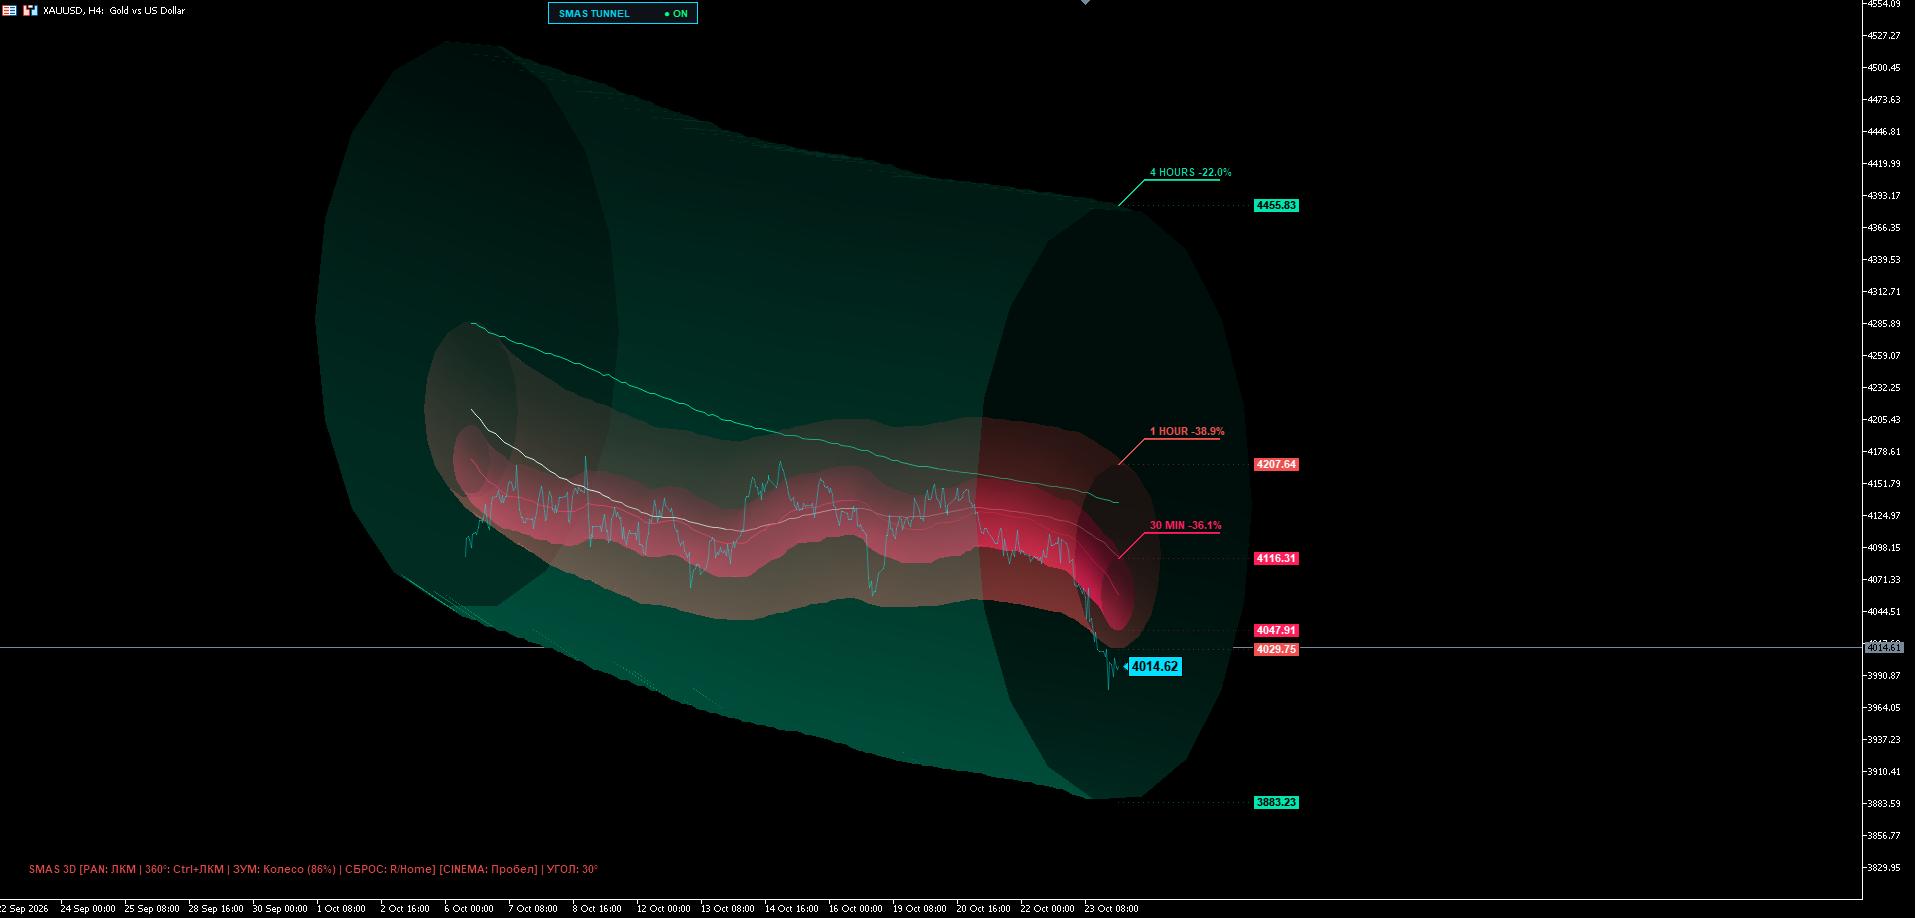
- The 3D Quantum Tunnel reveals price breaching the lower 1-hour boundary (4,029.75), entering an extreme oversold displacement phase.
- Intense selling velocity on H1 (-46°) collides with an underlying 6TF institutional demand floor anchored at 3,920–3,970.
Technical trajectory: The -17.3° descending channel
On the 4-hour chart, Spot Gold (XAU/USD) has experienced an aggressive downward acceleration, dropping over $150 from recent highs to trade at 4,011.52. The proprietary SMAS Structure Engine projects an invariant downward slope of -17.3°, with price action physically puncturing the lower boundary of the 3D wireframe volatility rails.
While the macro trend remains firmly bearish, the velocity of this descent is rapidly compressing price into the major psychological barrier at 4,000.00, where institutional limit order absorption typically initiates.
Spatial telemetry: 3D quantum tunnel breakdown
The multi-dimensional SMAS 3D Quantum Tunnel offers profound insight into the mechanics of this selloff:
- Outer Macro Conduit (4-Hour: -22.0%): Envelopes the broad cycle between the 4,455.83 ceiling and the terminal 3,883.23 baseline.
- Intermediate Conduit (1-Hour: -38.9%): Operating between 4,207.64 and 4,029.75.
- Inner Kinetic Core (30-Min: -36.1%): Calibrated between 4,116.31 and 4,047.91.
Key Observation: Current price action at 4,014.62 has physically broken completely below both the 30-minute inner core (4,047.91) and the 1-hour intermediate boundary (4,029.75). According to Chapter 9.5 of our quantitative framework (Terminal Boundary Collision), an un-contained displacement outside nested conduits reflects extreme kinetic exhaustion, where the probability of a violent mean-reversion rebound toward the central equilibrium axis expands significantly.
Order-flow telemetry and structural massifs (Sidebar 3D)
The Structure Balance 3D matrix registers an overall state of BALANCED [6 vs 7], reflecting an acute divergence between micro-panic and macro-anchors:
- The Kinetic Driver: The H1 timeframe registers a massive downward thrust of -46°, supported by M10 (-30°) and H2 (-28°).
- The Macro Stabilizer: The weekly baseline remains resiliently positive at W1 +26°, preventing an unmitigated structural collapse.
In the Sidebar 3D, the liquidity battleground is clearly mapped:
1. Immediate Overhead Resistance: Any corrective relief will confront a dense 4TF cluster (M5-M15-M30-H1) at 4,090–4,120, followed by a heavier 6TF massif at 4,220–4,270.
2. Foundational Support: Directly below the 4,000 threshold lies a monolithic 6TF demand super-massif (M30-H1-H2-H3-H4-D1) spanning 3,920–3,970, reinforced by substantial multi-order luminescence in Cluster Profile.
Tactical outlook and execution protocol
Chasing short positions at 4,011 with price severely extended beyond its 1-hour volatility boundary carries high negative expectancy.
- Mean-Reversion Long Setup: Aggressive tactical long positions are favored on confirmed absorption within the 3,995–4,015 pocket, with a tight Stop Loss below 3,975 (risking ~$25 to protect against a false 4,000 break).
- Take Profit Targets: Initial profit taking is projected at 4,075 (mean reversion to the 30-min core), with extended targets at the 4,110 resistance zone (+80 to +95 dollars).
- Trend Continuation Short Setup: Conservative trend followers should await a corrective relief pullback into the 4,090–4,115 supply zone to initiate shorts, targeting a final rotation down to the 6TF demand base at 3,940.
Author

Andrey Shvedov
SMAS Quantum Research
Andrey Shvedov is an active quantitative trader, software architect, and financial market researcher with over 24 years of live market microstructure experience.