Gold price analysis: The bulls takes place at $1740/oz

The DXY - US Dollar Index makes an adjustment which puts pressure on gold in the first session of the week. Right now, it is moving around 91,98 and 92,4.
There is a lot of news about social economics which makes gold moves slower these days.
For the bears, many ETF gold funds like SPDR Gold, iShare Gold, Gold Bullion, Goldman Sachs ETF,... continue to sell in the first quarter of 2021, that makes investors feel anxious. Moreover, there are many significant policies coming from Europe, the USA, China, Japan which on Covid-19 vaccinated activities and on national lockdown. These things make a positive consequence for the economy around the world.
For the bulls, the bullish trend was made by the speech of FED about chasing the lower interest rate, 120 billions bond auction monthly, keeping the inflation above 2%. The president of the US Federal Reserve - Mr. Powell, has said that these are the best way to get over the deceleration of economic growth. So investors keep their money on safe assets like gold and the "crypto gold" - Bitcoin.
Trend Analysis
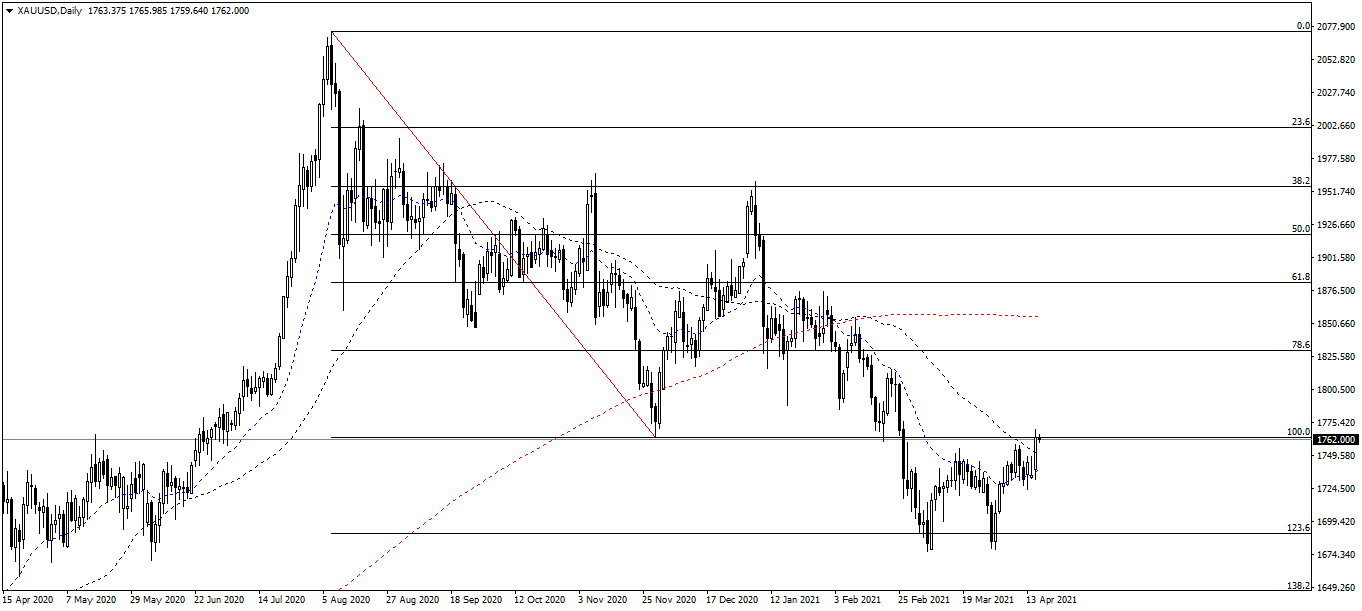
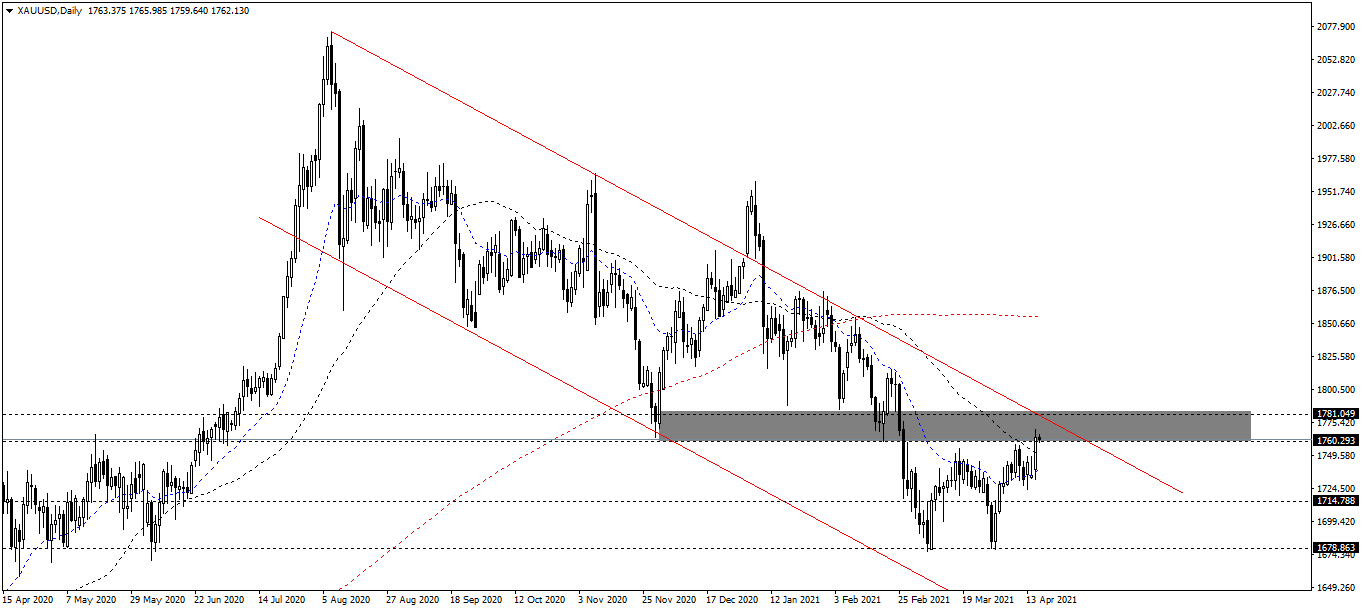
On the daily chart, gold is on the bearish trend (formed from August 2020) and the bullish trend (formed from June 2019). Gold had strongly fallen to $1678/oz and then came back to the uptrend at $1740/oz. (see chart below)
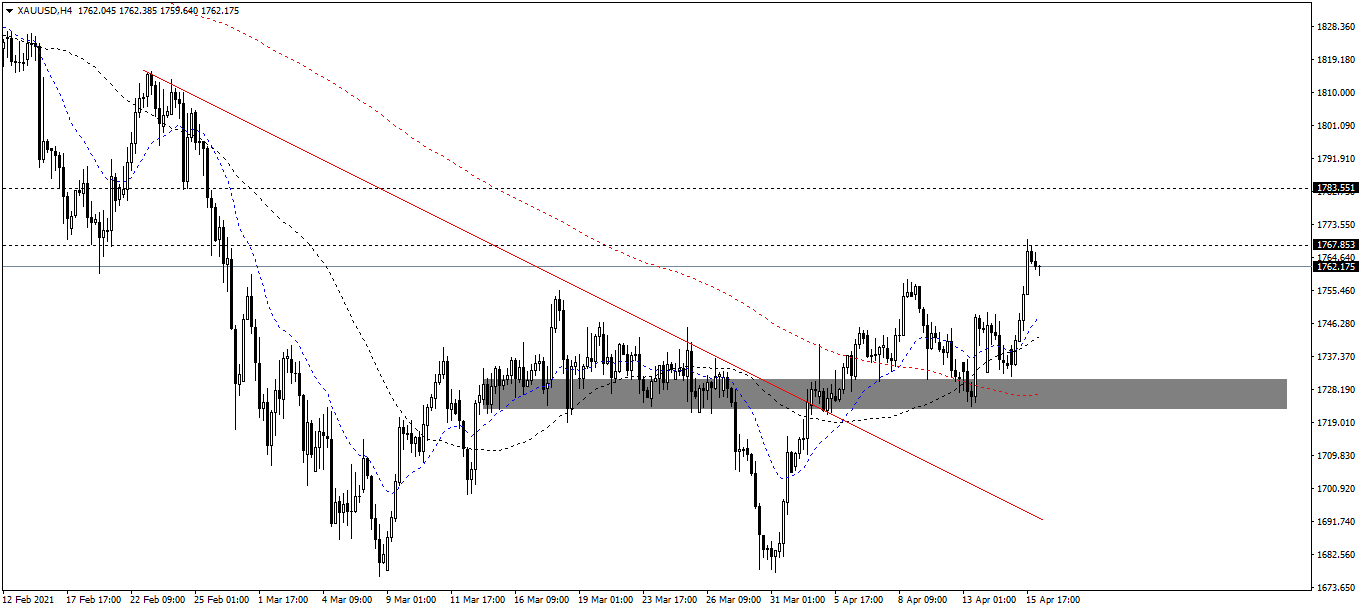
On the 4-hour chart, gold has confirmed the break-out of the bearish trend (formed from January 2021). In the last week, gold went up to $1759/oz and retested the old support at $1740/oz. The maximum wavelength is about $1780/oz. (see chart below)
Resistance/Support analysis
The resistances are $1780/oz and $1760/oz.
The supports are $1680/oz and $1715/oz.
Fibonacci analysis
The Fibonacci has measured on the daily chart at:
- The $2080/oz: this is the highest price of gold over the time.
- The $1760/oz: this is the oldest support on the bearish trend. (formed from August 2020).
Gold reaches the Fibonacci 100 and turns down, showing the significantly impressed resistance at $1760/oz. However, there is no bearish signal today.
Moving Average MA
On the daily chart, both the EMA20/SMA50 are going down and extend divergence from the SMA200. The EMA20 creates a reversal signal and climbs, heads for the SMA50 at $1760/oz - $1780/oz. Therefore, in the short-term, gold is bullish. But, in the mid-term and long-term, gold is bearish.
On the 4-hour chart, the EMA20 crossed the SMA200 and went up, showing the bullish trend. The SMA50 is highly likely bullish, heads for the SMA200, which shows the bullish trend. In conclusion, it is likely bullish on the 4-hour chart.
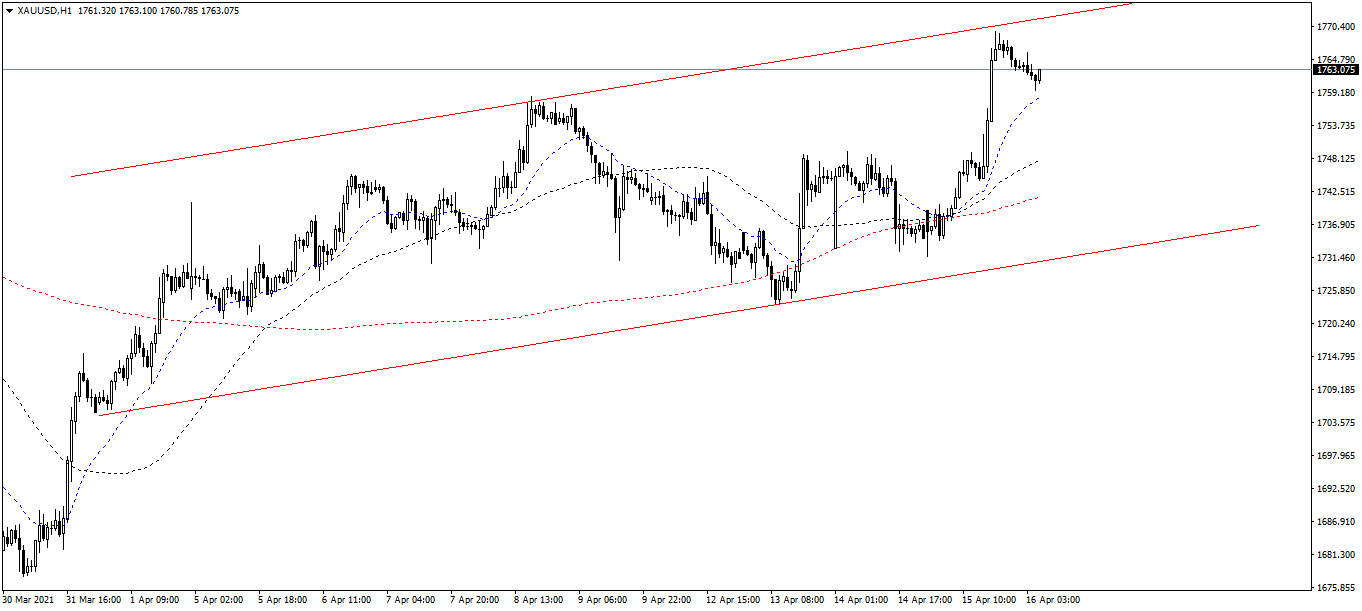
On the 1-hour chart, both the EMA20/SMA50 are above and extend divergence from the SMA200. So all 3 moving averages show the bullish trend.
Author

Thang Le
Independent Analyst
Thang Le is founder and owner of PSK - a financial community in Vietnam which at: Advising on strategic investment for individuals; Supporting the development of the investment community. He is Financial Analyst at Lion Group Hol


