XAU/USD outlook: Gold’s price to see heightened volatility?

Gold’s price has moved higher since our last report, with gold’s price currently above $3300 per troy ounce. In today’s report we intend to discuss fundamental issues that may be affecting the precious metal’s price action and conclude the report with a technical analysis of gold’s daily chart.
President Trump and President Xi Jinping to speak this week?
The uncertainty stemming from US President Trump’s intentions seems to be maintained and may be keeping gold’s price supported. We note as an example the recent tariff announcement on Friday of a 50% tariff on steel and aluminum imports. The updated tariff levies are set to go into effect on the 4th of June, with the announcement coming hours after the US accused China of violating an agreement to mutually roll back tariffs and trade restrictions for critical materials. The situation highlights how delicate the trade negotiations still are and thus the announcement may have heightened worries about the state of the global economy, which in turn may have aided gold’s price. However, the White House press secretary Karoline Leavitt stated per Reuters on Monday that US President Trump and Chinese President Xi Jinping will likely speak this week. Therefore, should the two leaders reach an agreement on tariffs, or the talks are described as “productive”, it may ease concerns over the global economy and could thus weigh on gold’s price. However, should no progress be made between the two leaders, it may have the opposite effect on gold’s price. Overall, in our view should the talks between the two leaders actually proceed, we would not be surprised to see the US touting them as productive, whilst seeing a more reserved tone from China in terms of how productive the talks may have been. In turn, this may blur the waters as to what may have been discussed and the true outcome of the possible talks between the two leaders and thus may lead to increased trading volatility.
Financial releases of interest for Gold traders
Over the coming days, there is one financial release which we would like to note could affect gold’s price. Specifically, the US Employment data is expected to showcase a loosening labour market based on the current expectations by economists. In particular the NFP figure is expected to come in at 130k which would be lower than last month's figure of 177k, whilst the average earnings rate is also expected to come in at 3.7% which would also be lower than the prior months rate of 3.8%. Lastly, the unemployment rate is expected to remain steady at 4.2%. Overall, should the employment data come in as expected and showcase a loosening labour market it may weigh on the dollar, whilst potentially aiding gold’s price given their assumed inverse relationship with one another. Whereas should the employment data showcase a resilient labour market, it could potentially aid the dollar whilst weighing on gold’s price.
Central bank Gold buying decreases in April
As closure we tend to note the recent report by the World Gold Council which has stated that “Global central banks bought a net 12t in April based on reported data, 12% lower than the previous month and below the 12-month average of 28t”. Moreover, per the same report, central bank net purchases slowed in April for a second month in a row which in turn may imply a reduction in demand for gold from central banks which may be perceived as bearish for gold’s price. Yet the WGC states that “we still expect overall buying to continue, given that the economic and geopolitical outlook remains highly uncertain”, a view which we tend to agree with and could thus aid gold’s price in the long run. Nonetheless, the report by the WGC may have bearish implications for gold’s price in the short term.
Technical analysis
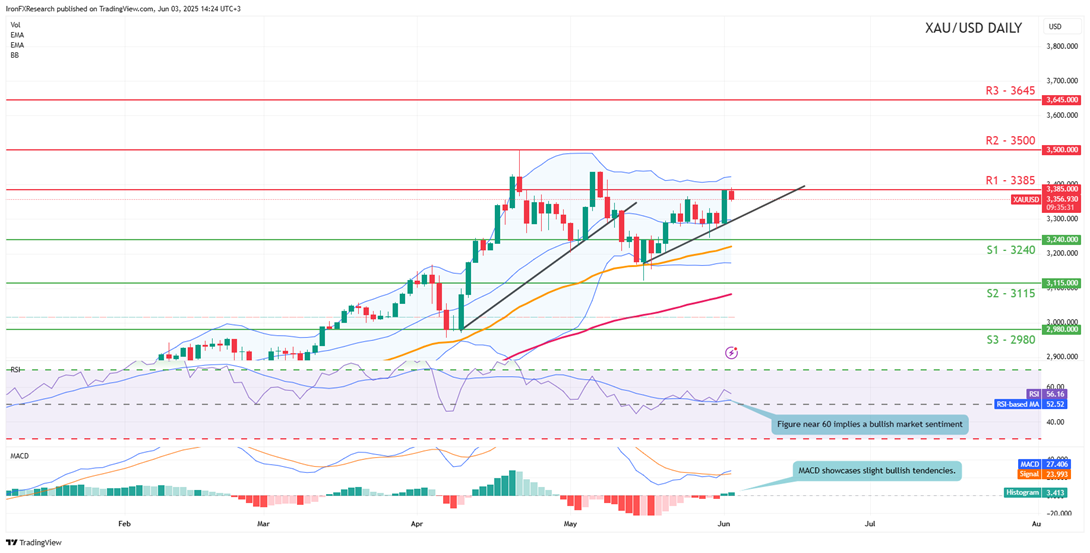
XAU/USD daily chart
-
Support: 3240 (S1), 3115 (S2), 2980 (S3).
-
Resistance: 3385 (R1), 3500 (R2), 3645 (R3).
Gold’s price appears to be moving in a predominantly upwards direction. We opt for a bullish outlook for gold’s price and supporting our case is the RSI indicator below our chart which currently registers a figure near 60, implying a bullish market sentiment, in addition to the MACD indicator. Furthermore, we would like to note the formation of our upwards moving trendline which was incepted on the 15th of May. For our bullish outlook to continue we would require a clear break above our 3385 (R1) resistance line, with the next possible target for the bulls being the 3500 (R2) resistance ceiling. On the other hand, for a sideways bias we would require the precious metal’s price to remain confined between the 3240 (S1) support level and the 3385 (R1) resistance line. Lastly, for a bearish outlook we would require a clear break below the 3240 (S1) support level with the next possible target for the bears being the 3115 (S2) support line.
Author

Phaedros Pantelides
Independent Analyst
Mr Pantelides has graduated from the University of Reading with a degree in BSc Business Economics, where he discovered his passion for trading and analyzing global geopolitics.


