Gold in 2019: Lessons for the Year Ahead

The King is dead, long live the King - 2019 is over, long live the 2020! As tumultuous as they have been, what have we learned about the gold market in the past twelve months? And what can we glean from this knowledge for the times ahead?
Key Lessons For Gold Investors from 2019
Today is the last day of 2019. It was a good year for the gold bulls, as one can clearly see in the chart below. The price of the yellow metal increased from $1279 to $1474 (as of December 18 – yes, we wrote this article before the festive break). It means that gold rose more than 15 percent in 2019. The gold bulls cannot complain!
Chart 1: Gold prices (London P.M Fix, in $) from December 2018 to December 2019
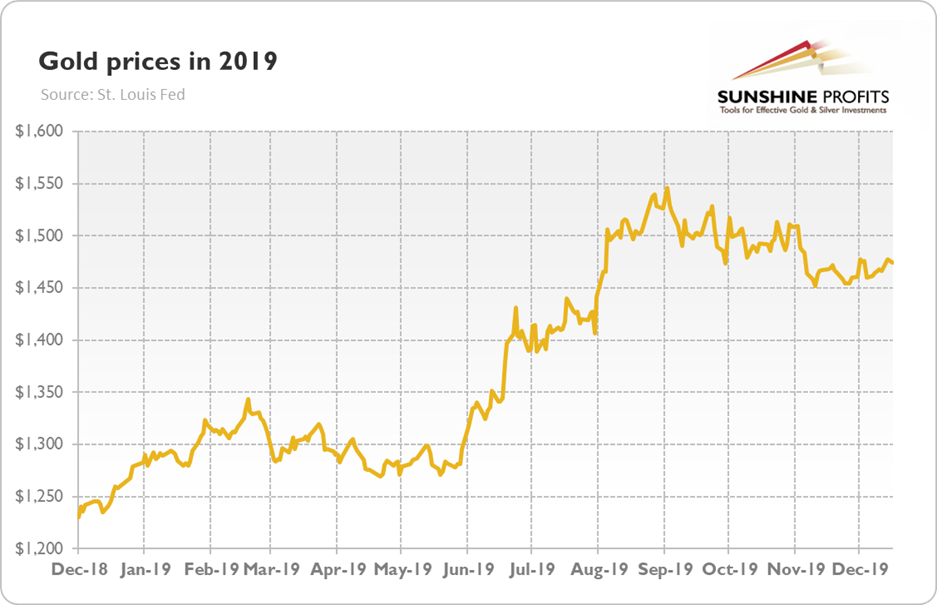
The main driver behind gold’s success were fears of a U.S. recession and the related dovish U-turn within the Fed, which cut the federal funds rate three times after hiking it four times in 2018.
However, it was not surprising. After four hikes in 2018, it was more than certain that the Fed’s stance would become more dovish and that the price of gold would then react favorably. What could be less expected was that the gold’s appreciation would occur simultaneously with the strengthening U.S. dollar. As the chart below shows, we have not observed the traditional strong negative correlation between the greenback and the yellow metal. Actually, both assets moved in tandem strongly up during the summer!
Chart 2: Gold prices (yellow line, left axis, P.M. Fix, in $) and the broad trade weighted US dollar index (red line, right axis) from January to December 2019
-637135446062582338.png)
Why? The recessionary fears boosted both the U.S.-denominated government bonds and gold. Although the yellow metal is the ultimate safe-haven, the U.S. Treasuries can also behave like a safe haven, at least when compared to other assets – due to the large liquidity flows they’re able to absorb. So, as I always repeat, do not mechanically follow gold’s correlations, but always look at the broader macroeconomic context!
The relationship between gold and the real interest rates seemed to be stronger in 2019. As one can see in the chart below, the peak in gold prices corresponded with the bottom in the bond yields. However, the correlation was far from being perfect. The real rates have been rising since January, while gold remained in a sideways trend until late May. It confirms that gold market is very complex and that gold investors should not count on simple automatic reactions.
Chart 3: Gold prices (yellow line, left axis, P.M. Fix, in $) and the yields on 10-year inflation-indexed Treasuries (green line, right axis, in %) from January to December 2019
-637135446580728500.png)
Implications for Gold in 2020
Gold showed in 2019 that it can shine even when the U.S. dollar appreciates and the stock prices reach new record levels. So, 2020 does not have to turn out badly for the gold market. However, the Fed is going to be neutral or cut interest rates once at most. It means that the U.S. central bank will be less dovish than in 2019. While this needn’t be a disaster for the yellow metal, investors should acknowledge that gold fundamentals are likely to deteriorate somewhatnext year (unless the next crisis occurs). Fundamentals are, of course, not everything, but it seems to me that gold would welcome some ignition to beat or come on par with its performance in 2019.
Anyway, tomorrow will be already January which used to be a positive month for gold prices. So Happy January and the whole 2020! And let all the gold come to you in the New Year… and in the 2020s!
Want free follow-ups to the above article and details not available to 99%+ investors? Sign up to our free newsletter today!
Want free follow-ups to the above article and details not available to 99%+ investors? Sign up to our free newsletter today!
Author

Arkadiusz Sieroń
Gold Price Forecast
Arkadiusz Sieroń received his Ph.D. in economics in 2016 (his doctoral thesis was about Cantillon effects), and has been an assistant professor at the Institute of Economic Sciences at the University of Wrocław since 2017.















