Gold Forecast: Bull flag breakout confirmed, is $1300 on the cards?

The heightened geopolitical tensions and the resulting risk aversion, coupled with dovish Fed speak pushed Gold to a high of $1278.76 on Thursday. The metal remains bid in the European session today, currently trading at $1280; the highest level since June 14.
Technicals - Bull flag breakout
4-hour chart
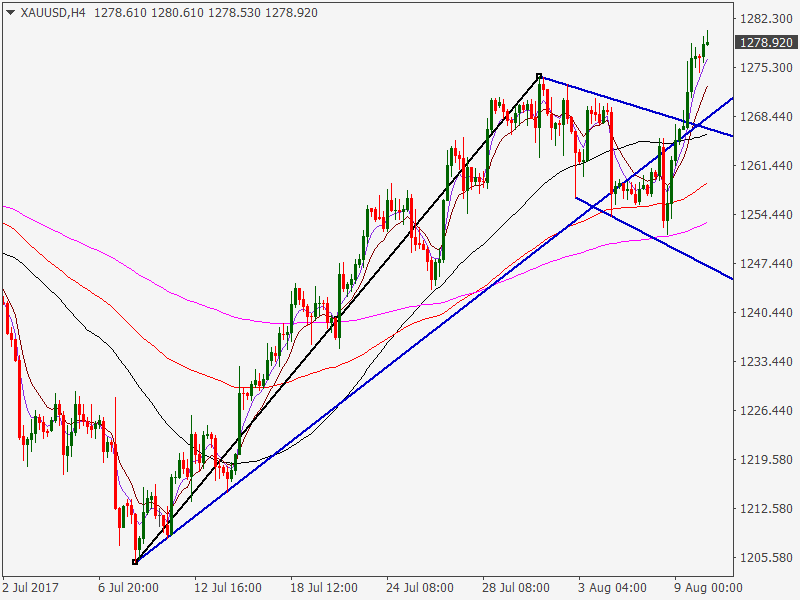
- A solid [supported by strong volumes] bull flag breakout - a bullish continuation pattern has opened doors for a rally to $1300.
- The previous two cyclical highs fell just short of the key psychological level.
- ‘Third time is the charm’… the level could be scaled this time; especially if tomorrow’s US CPI number misses estimates.
Daily chart - higher lows, higher highs established
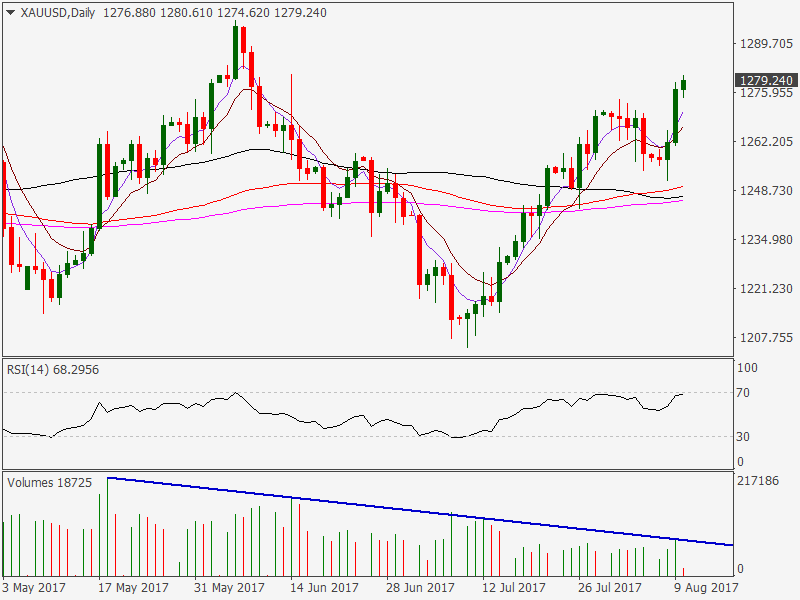
- Yesterday’s close above $1274.14 [Aug 1 2017] has confirmed a textbook higher lows and higher highs formation.
- The RSI, though very close to being overbought, still shows potential for rally.
- The only factor that warrants caution is - we are yet to see a convincing breach of the downtrend line on the volume chart. Nevertheless, bulls may take heart from the fact that yesterday’s breakout was accompanied by a spike in the volumes.
View
- Technicals do point to a potential for a rally well above the $1300 mark. However, a lot will also depend on the US CPI due for release tomorrow at 12:30 GMT and the inflation expectations.
- The US dollar could rally across the board and gold may revisit the area around $1260 if the July core CPI prints above the consensus estimate of 0.2% y/y.
Gold - bull trap?
-636379496907723448.png)
- The chart above shows gold prices respond negatively to rising inflation expectations as represented by the US 10-year breakeven inflation rate [difference between the yield on the US 10-yr Treasury inflation protected securities and the yield on the nominal 10-year Treasury].
- This is because the rising inflation expectations means the Fed would not hesitate to continue with the policy normalization process. Thus, higher inflation expectations mean a strong dollar and weak gold.
- It is only during the bouts of risk aversion that gold ignores rising inflation expectations…. the likes of which we are seeing now.
To conclude-
- The bull flag breakout could turn out to be a trap if the Geopolitical tensions ease. The other factor - inflation expectations - is working against gold.
- The metal may extend the rally to $1300-$1320 levels if the US CPI misses estimates.
Author

Omkar Godbole
FXStreet Contributor
Omkar Godbole, editor and analyst, joined FXStreet after four years as a research analyst at several Indian brokerage companies.
More from Omkar Godbole


