Gold failed to rally on the weakest jobs data in months. Here’s what the speculators are really doing

Gold (XAU/USD) trades near its lowest levels since August, extending a correction that has erased much of the late-summer rebound. Yet the most interesting development is not simply that Gold is falling. It is what the precious metal failed to do when the macroeconomic environment suddenly became more favorable.
September Nonfarm Payrolls (NFP) rose by only 29K, well below expectations of around 90K. The unemployment rate edged up to 4.2%, while annual wage growth slowed to 3%. Previous employment gains were also revised lower.
In a more conventional Gold market, that combination should have provided a powerful catalyst, as expectations for an October Federal Reserve (Fed) rate increase collapsed, removing part of the monetary-policy pressure that had weighed on the precious metal throughout September.
Gold initially responded, but the rally quickly faded. That failure matters because it suggests that the market is no longer trading only on expectations for the next Fed decision. Beneath the surface, another battle is taking place between rising long-term yields and increasingly divergent groups of Gold investors.
The jobs report gave Gold what it wanted, but not what it needed
The September employment report met most of the criteria for a Gold recovery. Expectations for an October Fed hike had already started to decline after softer-than-expected Personal Consumption Expenditures (PCE) inflation data. The employment report reinforced that shift as employment growth weakened sharply, wage pressures moderated and markets further reduced the probability of an immediate Fed hike.
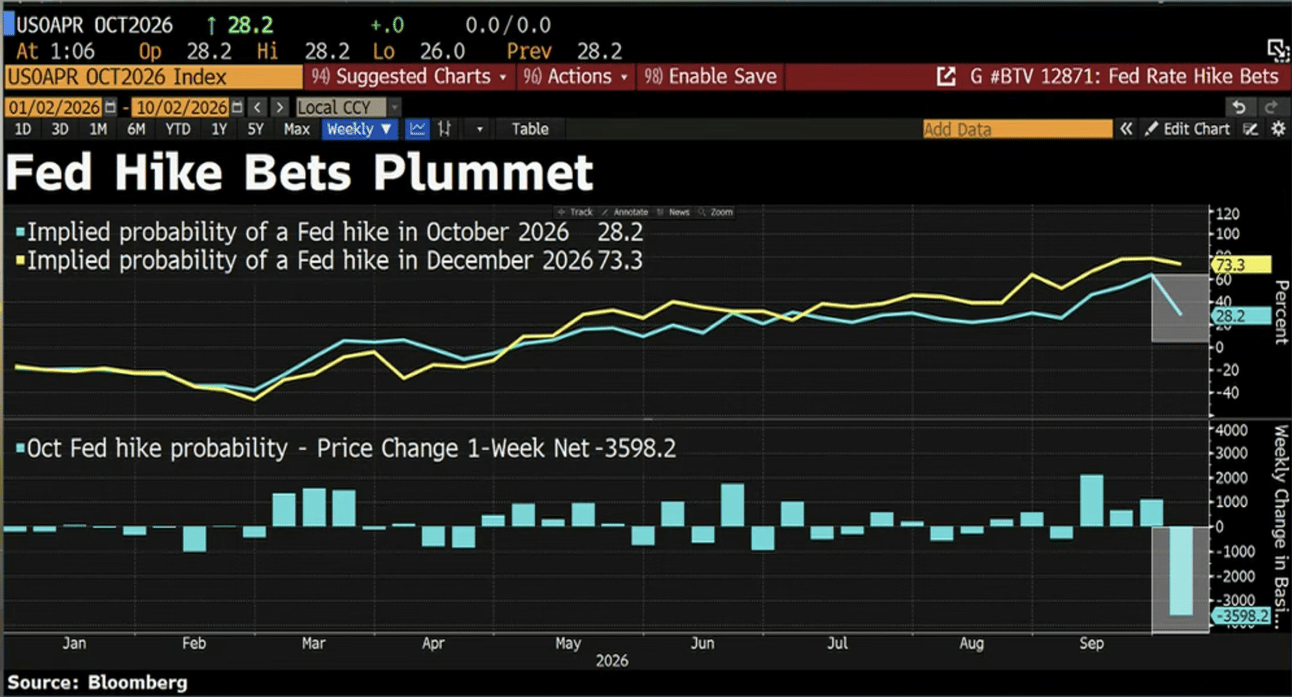
In theory, these developments should have provided a powerful catalyst for Gold. But the Treasury market refused to cooperate. Long-term US government bond yields remain close to multi-decade highs despite softer economic data. This disconnect between expectations for the Fed and the long end of the yield curve has become one of the most important forces affecting Gold.
OCBC summarizes the problem clearly: "Still waiting for yields to turn. Gold’s post-US payrolls rebound faded quickly despite a softer US labour report and a further pullback in October Fed hike expectations. The key issue is that long-end yields did not fall sustainably and the USD stayed firm, limiting follow-through in gold."
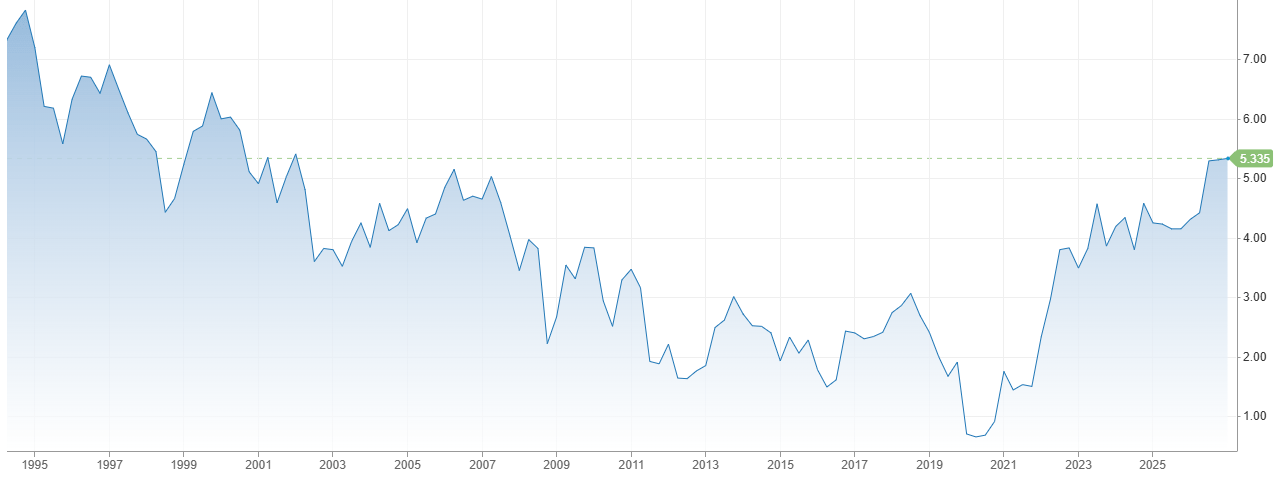
The distinction is crucial. The Fed directly controls very short-term interest rates, but longer-dated Treasury yields also incorporate inflation expectations, fiscal risks, debt supply and the term premium investors demand for holding government bonds over many years. Consequently, a weaker labor market can reduce expectations for near-term Fed tightening without necessarily producing the decline in long-term yields that Gold needs.
That is effectively what happened after the employment report. Expectations of another immediate interest rate increase fell dramatically, but investors continued to demand historically elevated yields on longer-term US government debt. Gold therefore received the benefit of a less hawkish Fed outlook without receiving equivalent relief from its most important opportunity-cost problem.
OCBC argues that this distinction remains decisive: "This reinforces the view that lower Fed hike risk alone may not be enough to drive the next leg higher. The more important catalyst is whether softer US data can pull long-end and real yields lower on a more sustained basis."
In other words, weak employment data may no longer be sufficient. Gold increasingly needs the bond market to confirm the message.
The real story is hidden in positioning
Gold’s inability to rally might initially look like evidence that investors are abandoning the precious metal. Positioning data tell a more complicated story. According to TD Securities, speculative traders have reduced their bullish exposure while simultaneously increasing short positions for three consecutive weeks. "Gold specs cut their long exposure while adding shorts for the third consecutive week, as rates across the curve and the greenback continue to drift higher," TD Securities notes.
That behavior is consistent with the price action. Rising yields, a resilient US Dollar (USD) and renewed inflation concerns have encouraged leveraged traders to reduce exposure to Gold.
But this is not a uniform investor retreat. TD Securities highlights a significant divergence between systematic Commodity Trading Advisors (CTAs) and other investors. CTAs, whose strategies tend to react mechanically to trends, volatility and price signals, remain pessimistic despite recently covering some short positions. The firm notes that "CTAs are now also covering modest shorts in the yellow metal but remain downbeat overall as prices need to top $4300/oz to induce further covering."
That makes $4,300 more than simply another round number. A recovery toward and above that area could begin changing the positioning of systematic strategies. Below it, CTAs have relatively little reason to abandon their bearish stance. The result is an unusual market structure: systematic investors are positioned defensively while other categories of buyers continue accumulating Gold.
CTAs are bearish. Discretionary investors are not
The divergence becomes more important when discretionary investors are considered. TD Securities notes that discretionary funds have been building long exposure even as systematic strategies remain cautious. Exchange-Traded Fund (ETF) demand and central-bank purchases are providing additional support. "Despite these near-term headwinds, ongoing ETF buying and demand from discretionary investors continue to provide support for gold," the bank adds.
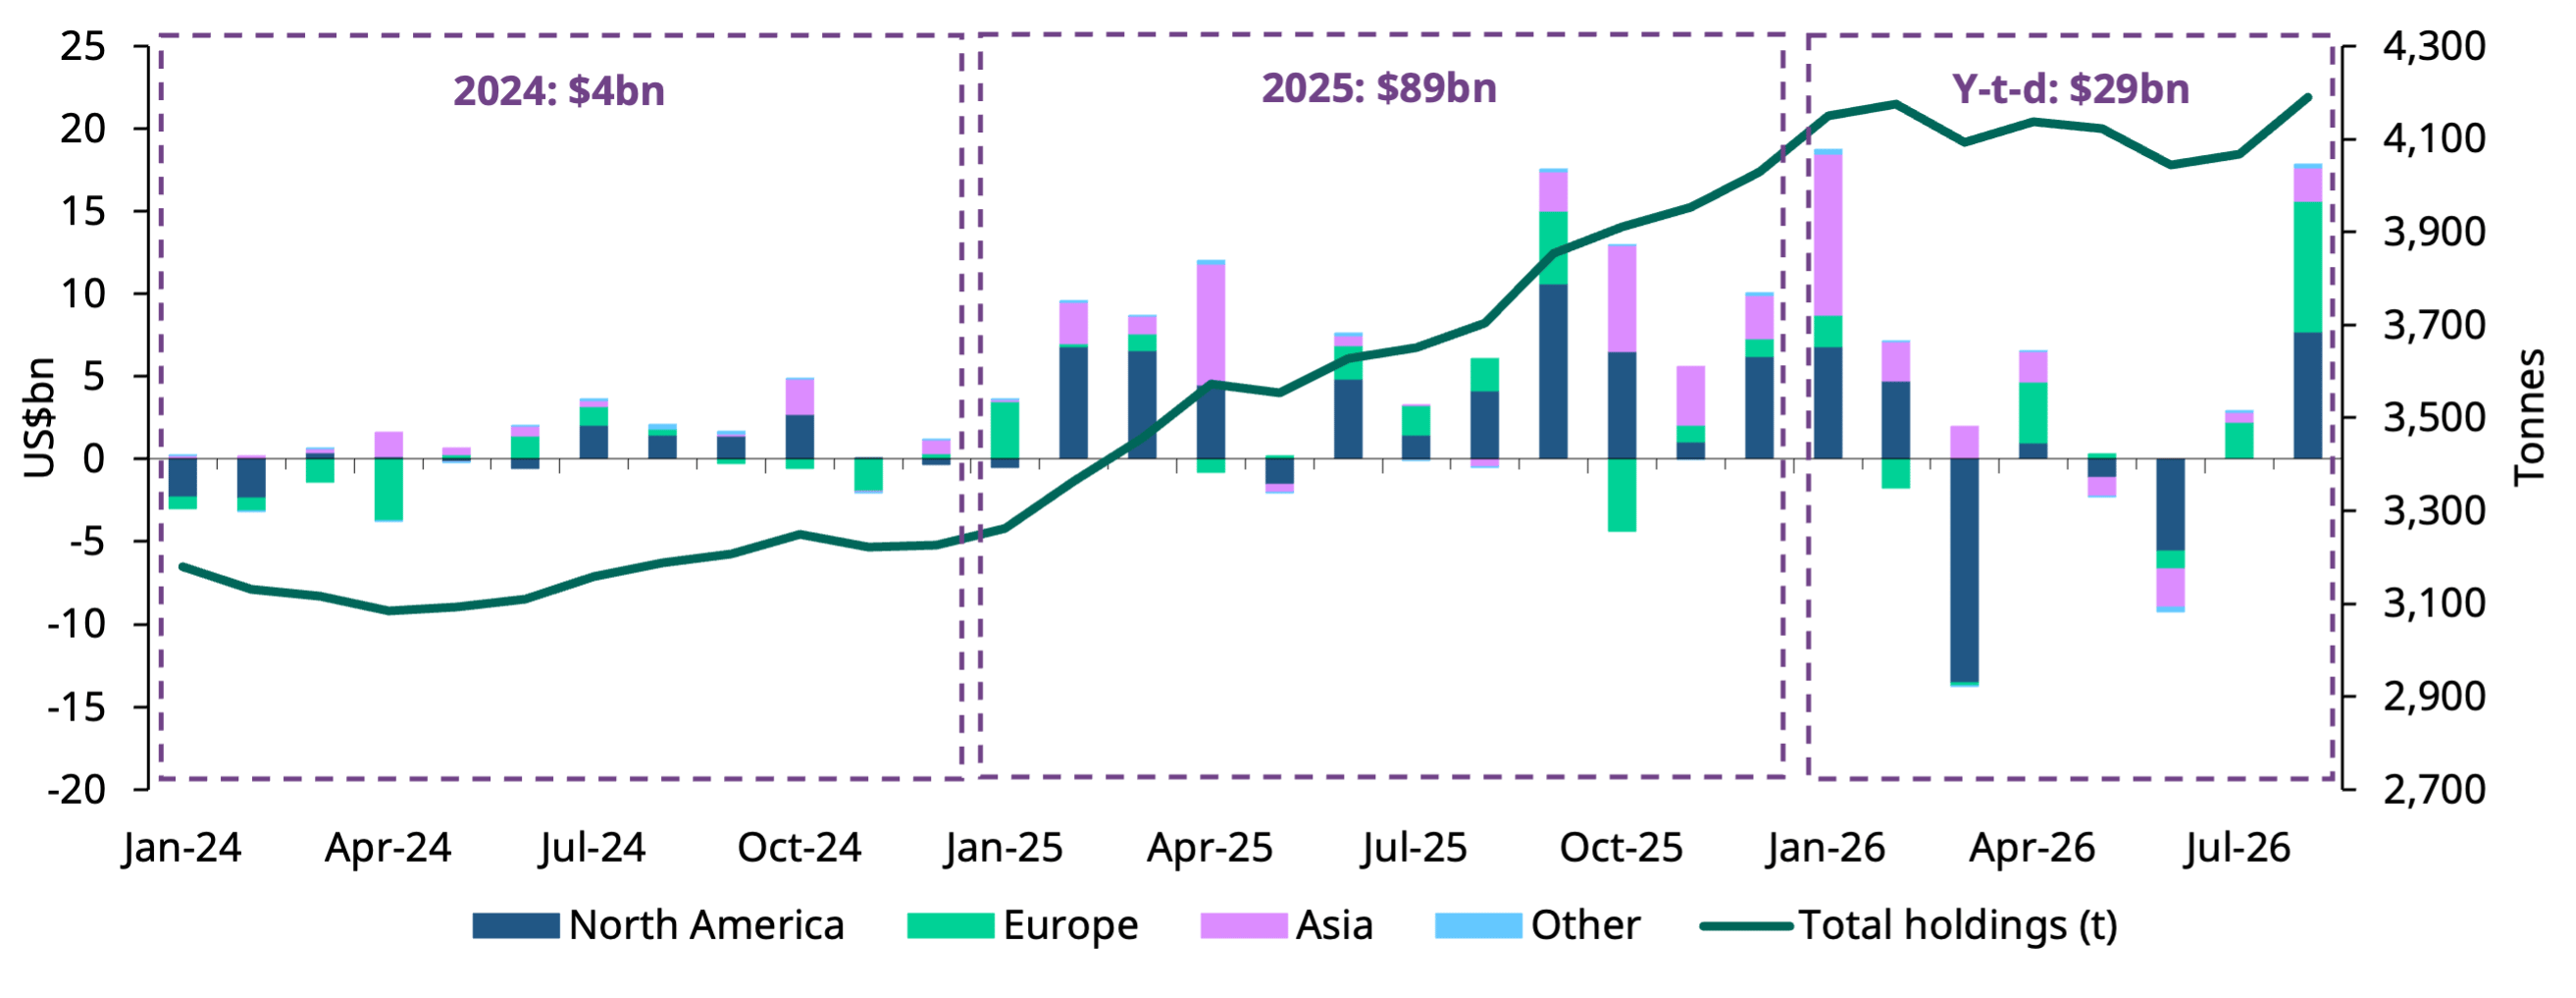
This helps explain one of the biggest paradoxes in the current market. Gold faces a combination that historically should be extremely difficult: elevated real yields, long-term Treasury yields near multi-decade highs, a strong US Dollar and expectations that the Fed has not necessarily completed its tightening cycle.
Yet Gold remains above $4,100, as weaker economic data, declining expectations of rate hikes and continued demand from discretionary traders, ETFs and central banks have allowed the metal to withstand the surge in real yields.
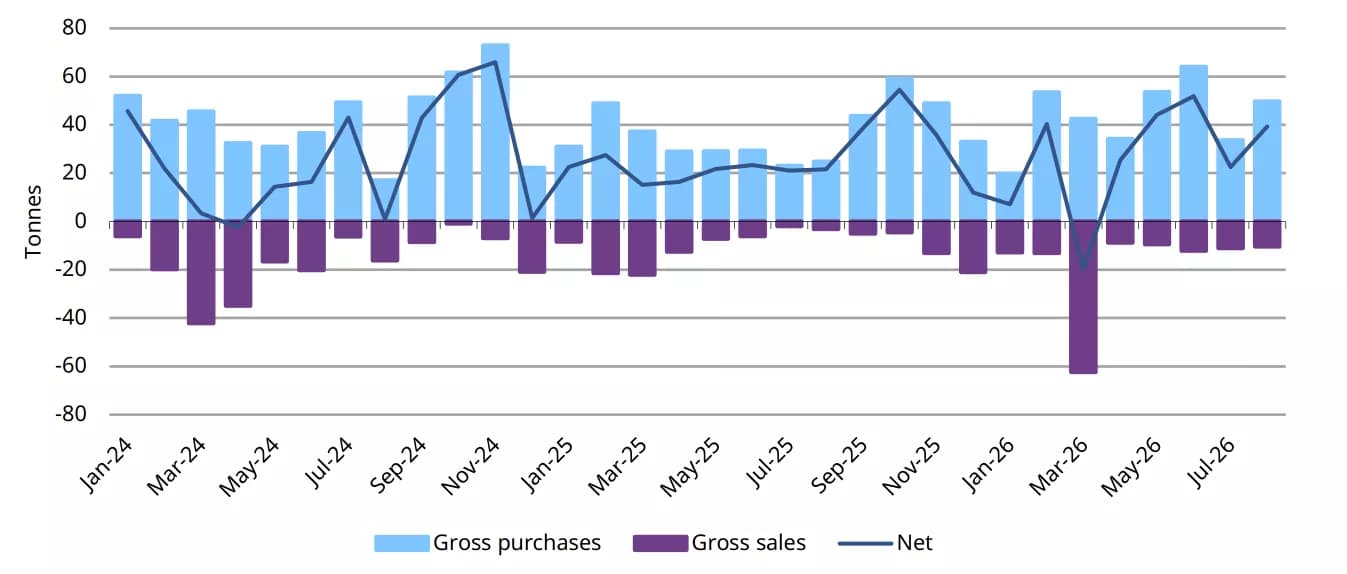
That resilience suggests that the current correction cannot be understood solely through speculative futures positioning. Short-term traders may be selling. Trend-following systems may remain bearish. But other pools of capital appear willing to take the opposite side of those trades.
The speculative shakeout could work both ways
The reduction in speculative long positions is bearish while it is happening, but positioning is not a one-directional indicator. Heavy long exposure can make a market vulnerable because too many investors are already positioned for higher prices. Conversely, the liquidation of those positions can eventually remove potential sellers.
That distinction becomes increasingly relevant after several weeks of speculative deleveraging. If yields continue climbing and the US Dollar remains firm, CTAs and other systematic traders could maintain or rebuild short exposure. Under that scenario, Gold could continue testing lower levels.
But if yields finally turn lower, the positioning mechanism could reverse rapidly. CTAs that are currently bearish would have to cover shorts as price signals improve. TD Securities identifies approximately $4,300 as the threshold required to encourage additional covering. That means a recovery above $4,300 would not simply reflect improving sentiment. It could itself generate incremental demand as systematic strategies adjust their positions.
The same positioning that currently reinforces weakness could therefore amplify an eventual recovery.
$4,100 is becoming the immediate battlefield
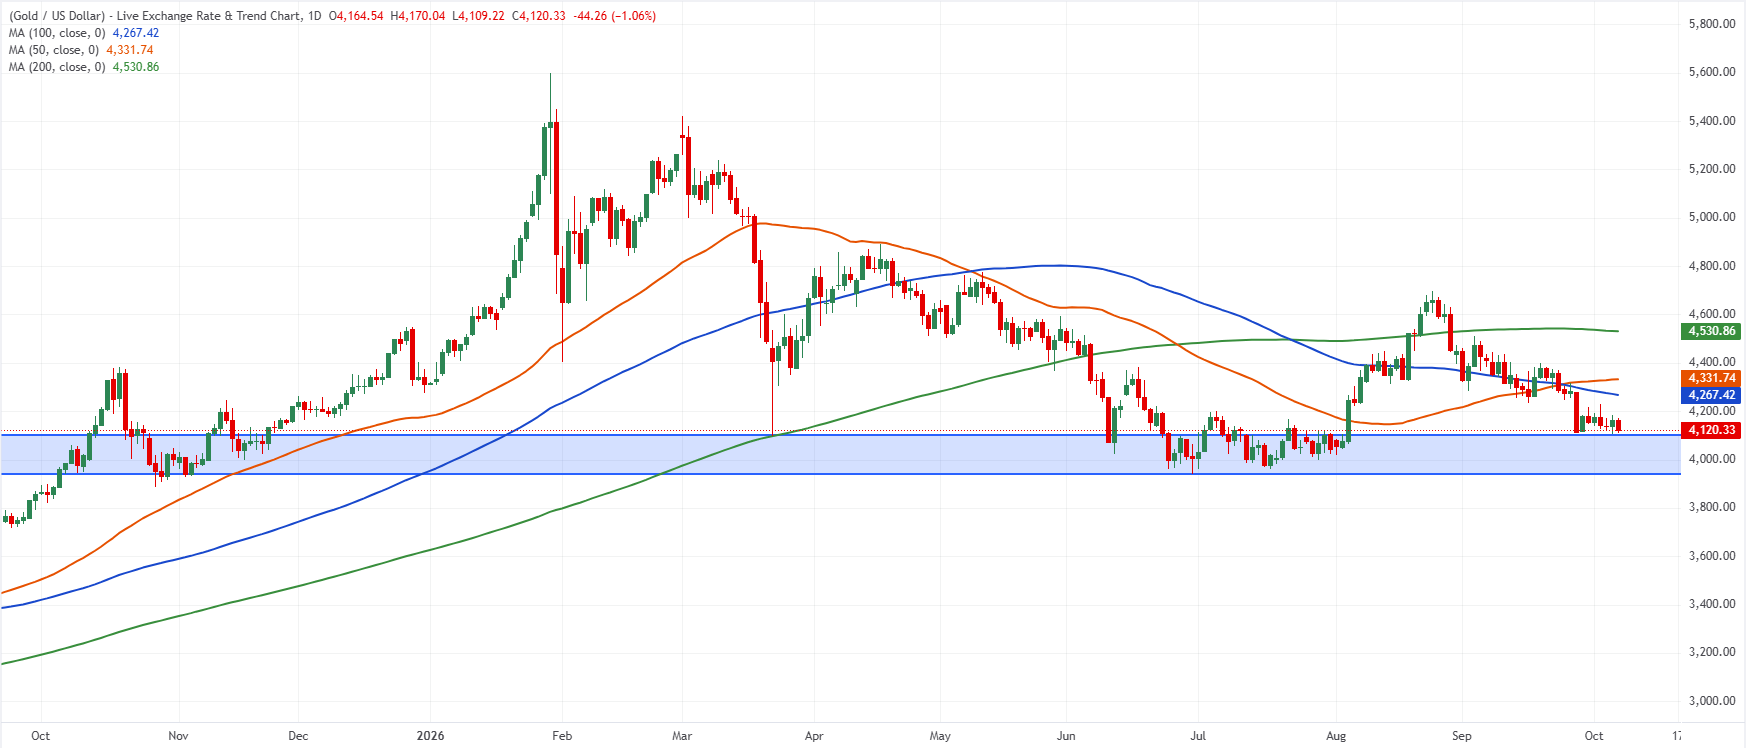
The daily chart reflects the same tension visible in positioning. Gold trades around $4,110, below its 50-day, 100-day and 200-day simple moving averages (SMAs), currently near $4,332, $4,267 and $4,531, respectively. The configuration keeps the medium-term technical structure under pressure.
The precious metal has also produced a sequence of lower highs since its January peak, while the late-August recovery failed around $4,700. A failure to defend the $4,100 support area could expose $4,000 and eventually the June-July troughs around $3,960-$3,940.
The importance of this zone extends beyond a single technical level. Gold repeatedly found demand around $4,000 during the summer, making the broader $4,100$-3,940 region an important test of whether structural buyers remain willing to absorb speculative selling.
A decisive break below this area would strengthen the bearish argument because it would suggest that long-term demand is no longer sufficient to neutralize pressure from yields and systematic strategies.
A rebound from the $4,100 region would put the recent pivot high around $4,225 back into focus. A break above this level could then expose the $4,300-$4,330 area, where the 50-day and 100-day SMAs converge.
This zone is particularly important as TD Securities estimates that Gold needs to rise above $4,300 to trigger further short covering from CTAs. A sustained break higher could therefore reinforce the rebound through systematic buying, with the 200-day moving average near $4,531 emerging as the next major hurdle.
The contradiction is the signal
Gold’s reaction to the September employment report initially looks disappointing for bulls. The weakest employment growth in months sharply reduced expectations for another immediate Fed hike, yet Gold could not sustain a rally. As long as long-term and real Treasury yields remain elevated, that failure deserves attention.
But the positioning underneath the price action makes the conclusion less straightforward. Speculators have cut longs and increased shorts for three consecutive weeks. CTAs remain bearish. Yet discretionary investors, ETFs and central banks continue to buy.
Gold is therefore being pulled in opposite directions by investors operating on very different horizons. Short-term systematic money sees deteriorating momentum and elevated yields. Longer-term investors see weaker economic data, eventual limits to Fed tightening, fiscal risks and structural reasons to diversify into Gold.
That tension helps explain why the metal is weak without collapsing.
The next move may depend less on another isolated economic release than on which group is ultimately forced to change its position. If long-term yields continue rising, Gold’s failure after the employment report could prove to have been an early warning that the $4,000 area will not hold indefinitely.
If yields finally retreat while Gold remains above its summer support zone, however, the calculus changes. The speculative shorts accumulated during the correction could become potential buyers, and a recovery through $4,300 could begin forcing systematic strategies back toward the bullish side.
Gold FAQs
Gold has played a key role in human’s history as it has been widely used as a store of value and medium of exchange. Currently, apart from its shine and usage for jewelry, the precious metal is widely seen as a safe-haven asset, meaning that it is considered a good investment during turbulent times. Gold is also widely seen as a hedge against inflation and against depreciating currencies as it doesn’t rely on any specific issuer or government.
Central banks are the biggest Gold holders. In their aim to support their currencies in turbulent times, central banks tend to diversify their reserves and buy Gold to improve the perceived strength of the economy and the currency. High Gold reserves can be a source of trust for a country’s solvency. Central banks added 1,136 tonnes of Gold worth around $70 billion to their reserves in 2022, according to data from the World Gold Council. This is the highest yearly purchase since records began. Central banks from emerging economies such as China, India and Turkey are quickly increasing their Gold reserves.
Gold has an inverse correlation with the US Dollar and US Treasuries, which are both major reserve and safe-haven assets. When the Dollar depreciates, Gold tends to rise, enabling investors and central banks to diversify their assets in turbulent times. Gold is also inversely correlated with risk assets. A rally in the stock market tends to weaken Gold price, while sell-offs in riskier markets tend to favor the precious metal.
The price can move due to a wide range of factors. Geopolitical instability or fears of a deep recession can quickly make Gold price escalate due to its safe-haven status. As a yield-less asset, Gold tends to rise with lower interest rates, while higher cost of money usually weighs down on the yellow metal. Still, most moves depend on how the US Dollar (USD) behaves as the asset is priced in dollars (XAU/USD). A strong Dollar tends to keep the price of Gold controlled, whereas a weaker Dollar is likely to push Gold prices up.
Author

Ghiles Guezout
FXStreet
Ghiles Guezout is a Market Analyst with a strong background in stock market investments, trading, and cryptocurrencies. He combines fundamental and technical analysis skills to identify market opportunities.