Gold enters new structural phase after weekly close above 4,350

XAU/USD clears a long-term structural barrier as supply-and-demand symmetry comes into focus.
Gold futures — Macrostructure desk observation
As of December 24, 2025
Weekly timeframe | Long-term structural blocks | Supply–demand mapping
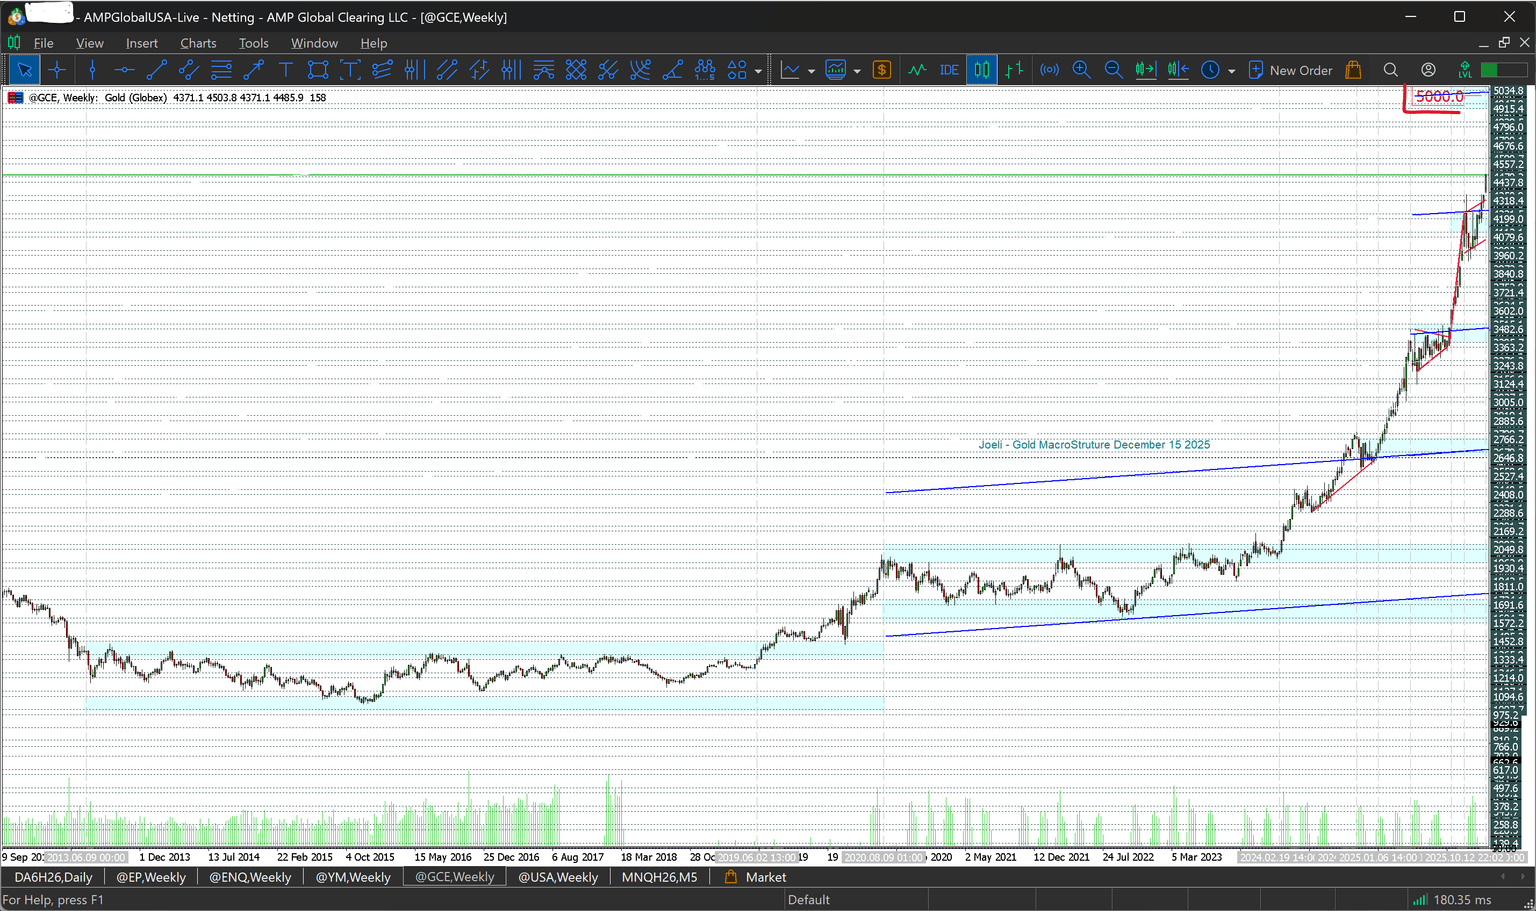
Gold futures have now moved through a long-term structural barrier, marking an important transition point in the broader cycle. After a multi-year advance defined by repeated rotations and measured expansions, price has closed above the 4,350 extension zone, a level highlighted in the previous desk update as a key structural reference.
This report builds on that earlier observation. Rather than simply noting the condition, it lays out the specific structural reference points that explain how price arrived at this level and how the current phase fits within gold’s longer-term behaviour. The focus remains on structure and response, not prediction.
MacroStructure phases
Balance → Expansion → Rotation → Stress test
1. 2013–2019: Balance and base formation
From August 2013 through June 2019, gold traded in a prolonged balance phase, consolidating between approximately 1,365 and 1,127.
- Structure: ~4 supply-and-demand blocks
- Behaviour: two-sided trade with repeated acceptance
- Outcome: long-term base formation
This period laid the structural foundation for the multi-year cycle that followed.
2. 2019–2020: Expansion cycle I
Gold broke out of balance in July 2019, entering a clear expansion phase that carried price from 1,365 to around 2,000 by July 2020.
- Structure: ~6 supply-and-demand blocks
- Behaviour: directional advance with limited pullback
This move established the measured-block behaviour that has continued to define gold’s price action.
3. 2020–early 2024: Rotation and re-acceptance
After reaching 2020 highs, gold entered a prolonged consolidation phase, trading between roughly 2,000 and 1,622 from July 2020 through February 2024.
- Structure: ~4 supply-and-demand blocks
- Behaviour: time-based consolidation rather than deep retracement
This phase reflected re-acceptance of higher value, not a breakdown of the broader trend.
4. 2024: Expansion cycle II
In February 2024, gold resolved higher out of rotation, beginning another measured expansion.
- February–October 2024: 2,000 → 2,766
- Structure: ~6 supply-and-demand blocks
Once again, price respected the same structural symmetry observed in earlier cycles.
5. Early 2025: Expansion cycle III
That expansion extended into early 2025:
- January–April 2025: 2,766 → 3,482
- Structure: ~6 supply-and-demand blocks
By this stage, gold had completed multiple consecutive expansion legs with minimal structural disruption.
6. Mid-2025: Acceleration into extension
From August to October 2025, price accelerated sharply:
- 3,482 → ~4,350
- Structure: six blocks, briefly extending beyond before rotating
This move carried gold into a long-term extension zone, where upside progress historically becomes more selective and structurally sensitive.
7. Current phase: Acceptance above 4,350
In the week ending December 25 (Christmas week), gold closed above the 4,350 level, confirming acceptance above a structural reference identified in the previous report.
This close represents a structural transition, not a directional signal. Acceptance above this zone shifts focus to how price behaves within the next structural phase.
Current six-block supply-and-demand range: 4,350–5,000
With acceptance established above 4,350, gold has entered the early stage of a new six-block supply-and-demand range, measured from the current structural base.
Based on historical block symmetry and prior expansion behaviour, the active six-block range for this phase spans approximately 4,350 to 5,000. This range does not imply direction or timing. It defines the structural bandwidth within which price may rotate, consolidate, or expand, provided acceptance above the lower boundary is maintained.
As with prior cycles, this range exists before price explores it. How much of the range is ultimately traversed will depend on price behaviour at internal structural references, not on external narrative.
Projected structural references (not yet reached)
Within this six-block range, projected structural reference zones are identified around:
- 4,470
- 4,590
- 4,710
- 5000
These levels have not yet been reached. They are forward structural references, calculated from historical supply-and-demand symmetry and block behaviour. They are not price targets.
As with previous cycles, structure leads, and price follows, provided acceptance is maintained. Structure can change or invalidate projected references at any time, across all timeframes, depending on price behaviour. This principle applies consistently across asset classes.
Downside references if rotation develops
If price fails to hold above 4,350, downside structure remains well defined:
- 4,200
- 4,083
- 3,992
A pullback into these zones would still fit within a rotation scenario, rather than signalling a breakdown of the broader trend.
Cross-asset structural symmetry: Gold and Bitcoin
Gold’s current behaviour closely mirrors the measured six-block supply-and-demand structure observed in Bitcoin, as detailed in the recent BTC/USD desk observation.
In both markets, price has rotated, consolidated, and expanded in six-block sequences, with stress-test or rotation phases emerging only after those expansions mature. At present, gold has completed and extended a six-block expansion into a structural transition, while Bitcoin has retraced roughly five blocks from its recent highs.
The same six-block supply-and-demand symmetry observed in Bitcoin is now clearly visible in gold, reinforcing the cross-asset consistency of the MacroStructure framework.
Macro alignment with the current Gold cycle (observational)
While structure defines the cycle, major phases of gold have tended to align with broader macro environments, particularly at structural transition points.
The 2013–2019 balance phase coincided with relative monetary stability and subdued inflation pressures. The 2019–2020 expansion aligned with falling real yields and renewed monetary accommodation. From 2020 through early 2024, gold rotated during a period of policy tightening, yield volatility, and shifting inflation expectations.
The recent expansion and extension into 2025, including the break above 4,350, has occurred amid persistent fiscal strain, geopolitical uncertainty, and ongoing debate around monetary credibility. These conditions did not create the structure — they aligned with it.
Desk takeaway
- Gold has respected repeatable six-block supply-and-demand symmetry for more than a decade
- The close above 4,350 marks a meaningful structural transition
- The current six-block range is defined between 4,350 and ~5,000, conditional on acceptance
- Forward references exist but remain dependent on price behaviour
- The same MacroStructure logic applies consistently across asset classes
Structure defines the battlefield. Levels exist before price arrives. Document response, not prediction.
Author

Denis Joeli Fatiaki
Independent Analyst
Denis Joeli Fatiaki possesses over a decade of extensive experience as a multi-asset trader and Market Strategist.


