Gold Bull and Bear Markets

In the previous part, we thoroughly analyzed the bull and bear trends in the U.S. dollar. But what about gold cycles? Let’s look at the chart below, which shows the long-term behavior of gold prices.
Chart 1: Gold bull and bear cycles (from 1971 to 2018, London P.M. Fix, in $).
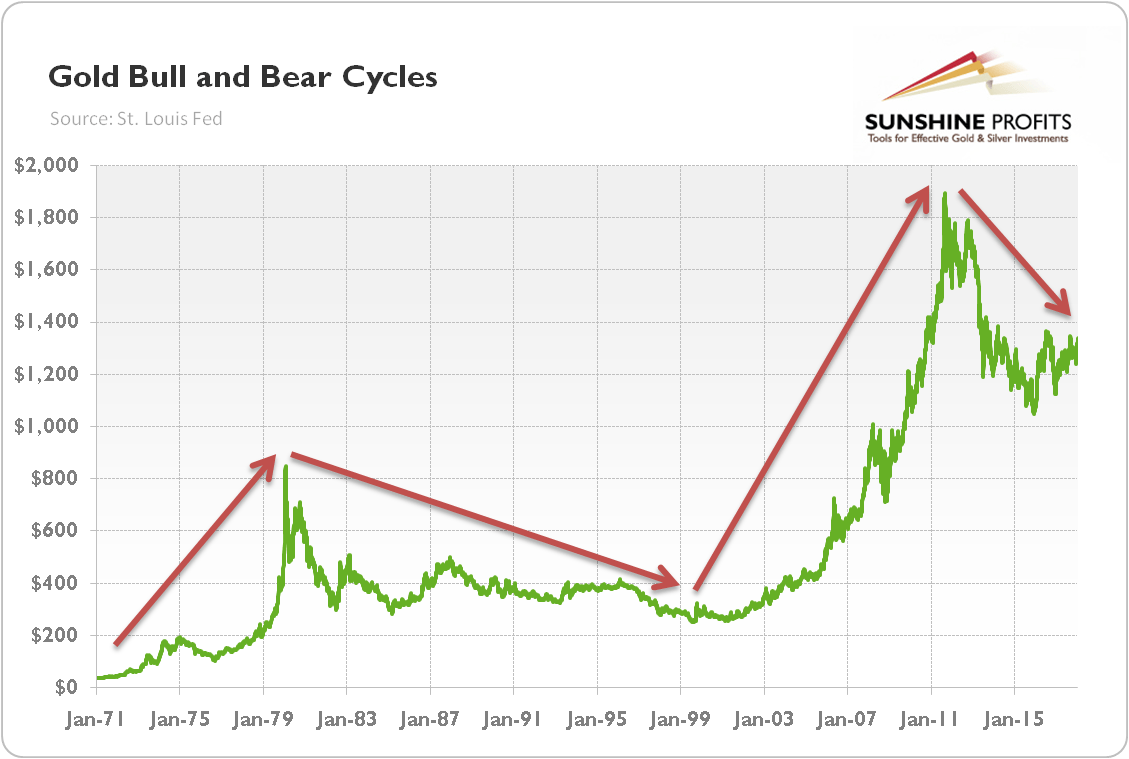
As one can see, there were only four cycles compared to six in the U.S. dollar: two gold bull markets and two gold bear markets. The first bull market started symbolically in August 1971, when President Nixon closed the gold window and terminated the gold standard. The collapse of Bretton Woods and the following surge in inflation caused a rally in gold. The bonanza ended in 1980, as the U.S. inflation rate started to decline thanks to the aggressive actions of Paul Volcker, the Fed Chair at the time. As the economy flourished, while the greenback strengthened, the yellow metal entered that bear market. It lasted until 1999/2001, when the dot-com bubble burst. In the 2000s, due to the financial turmoil, rising public debt, and the new wave of terrorism,the confidence in the American economy and its currency dropped, and gold reached its all-time height of $1,895 in 2011. But the economic recovery after the Great Recessionhas been pushing gold down. Interestingly, a similar (although not identical) pattern – i.e., two bull markets interrupted by a lengthy two decade bear market – can be found in most of the commodities.
Let’s see whether gold will continue its bearish trend or turn it upside. The historical analysis is even more difficult than with the case of the U.S. dollar, as gold experienced only one bear market before the current (recent?) one. All conclusions drawn from such a comparison should thus be taken with a grain of salt.
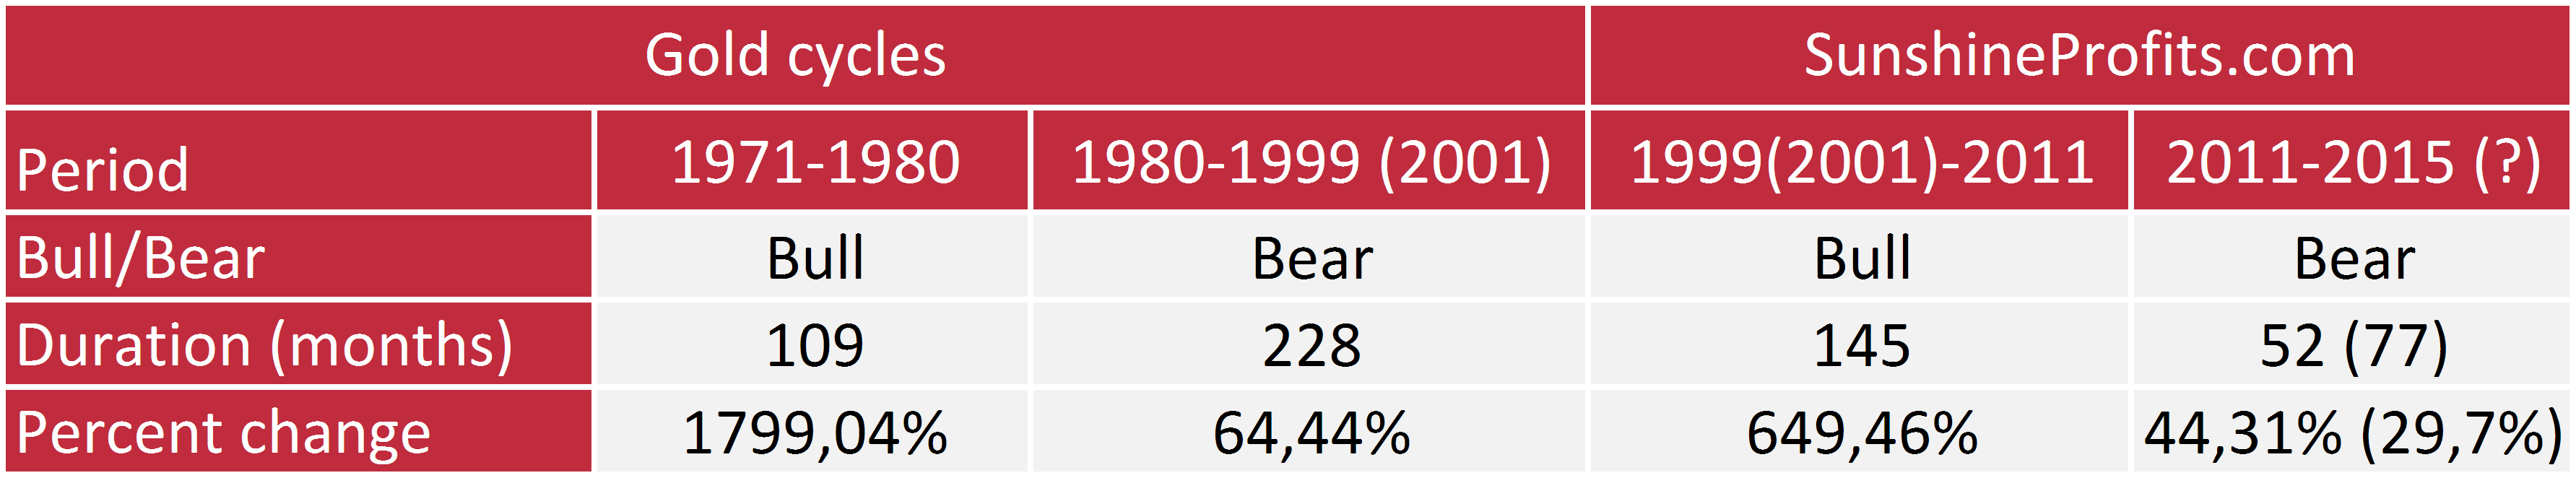
Having said that, it is worth noting that the previous bear market persisted 228 months and gold prices then plunged 64.44 percent. The bear market which originated in 2011 lasts only 77 months, and the price of gold fell just 29.7 percent (if we assume that the bear market ended in December 2015, it would have survived only 52 months with a 44.31percent decline). Hence, looking at duration and the cumulative percent change during each phase of the cycle (see the table below), we might still be in the gold’s secular bear market (it seems unlikely, but if history repeats exactly, the price of gold will decline to about $660 in 2031), and is now experiencing a technical rally.
Table 1: Historical gold cycles from 1971 to 2018.
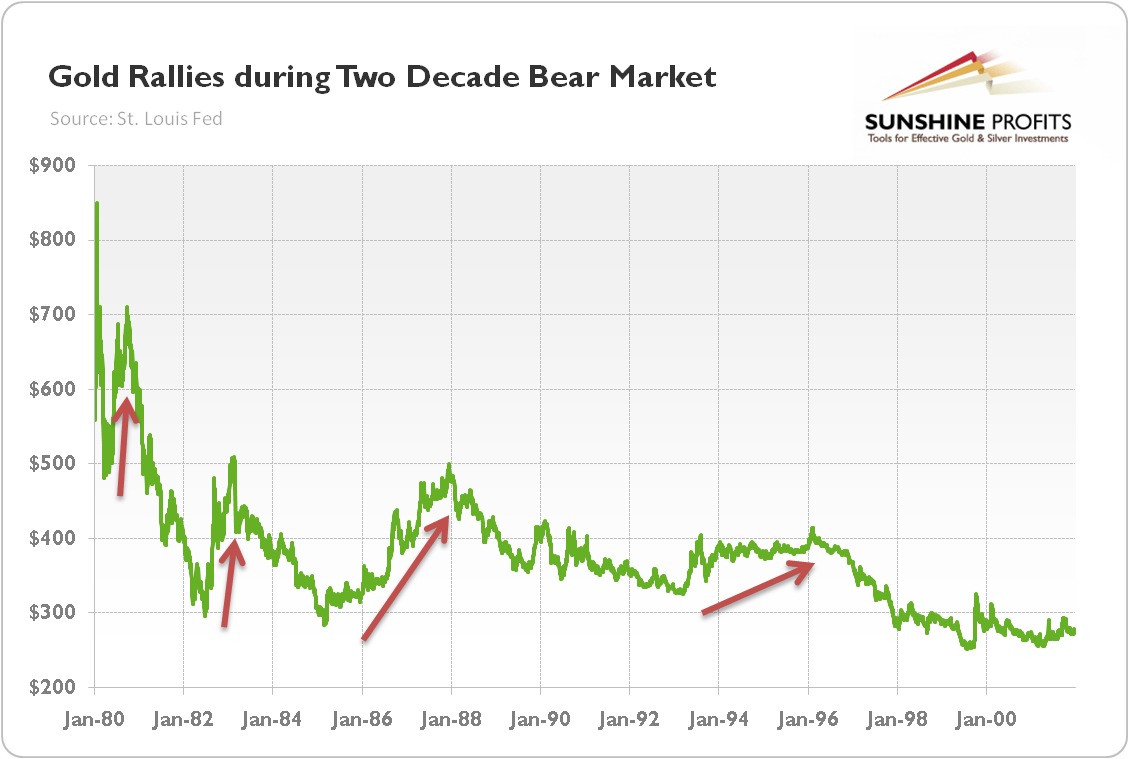
It’s completely possible: during a two decade bear market, gold had four significant rallies (see the chart below). The first was short and occurred between March and September 1980 – the shiny metal gained 47.66 percent then. The second rally happened between June 1982 and February 1983 – gold jumped 71.36 percent during that move. Gold also soared between February 1985 and December 1987, gaining 75.81 percent. Last but not least, gold surged 26.85 percent from March 1993 to February 1996.
Chart 2: Gold rallies during the two decade bear market (from 1980 to 2001, London P.M. Fix, in $).
The last two rebounds lasted about 34-35 months, so the current rally (if it started in December 2015) still has 8-9 months to align with the pattern. And since December 2015 gold jumped about 26 percent, so it has some room for further gains. If historical patterns hold, gold could reach almost $1,600 before continuing its secular downward move.
Please note that the above conclusions are generally in line with the analysis of the U.S. dollar cycles. The chart below plots the cycles in both of these assets together. The correlation is not perfect (the first half of the 1990s is a bit tricky), but it is substantial.
Chart 3: Bull and bear cycles in the U.S. dollar (Trade Weighted Index against major currencies) and gold (yellow line, London P.M. Fix, in $) from 1973 to 2018.
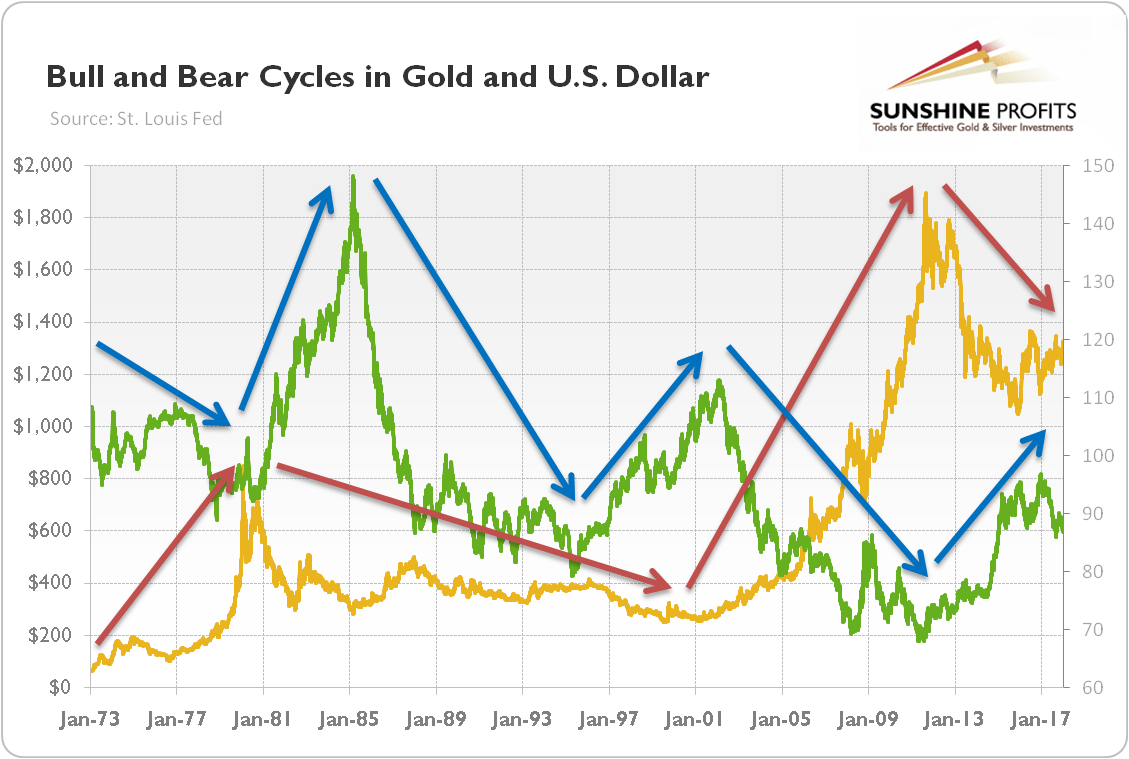
The greenback could weaken further in the medium term, but the secular bull market may be not over. It would imply that gold may continue its rally for a while before the day of reckoning will come. What is important is that the tax cuts are not deficit-neutral, so they will widen the fiscal deficit. The increase in the public debt will not only spur some safe-haven for gold acquisition, but it could also raise the dollar supply, contributing to the decline in the U.S. dollar. Since the USD seems to currently be at a decisive point or close to it, we should see either confirmations or invalidations of the above relatively soon.
If you enjoyed the above analysis and would you like to know more about the U.S. dollar and gold cycles, we invite you to read the FebruaryMarket Overview report. If you’re interested in the detailed price analysis and price projections with targets, we invite you to sign up for our Gold & Silver Trading Alerts. If you’re not ready to subscribe yet and are not on our gold mailing list yet, we urge you to sign up. It’s free and if you don’t like it, you can easily unsubscribe. Sign me up.
Want free follow-ups to the above article and details not available to 99%+ investors? Sign up to our free newsletter today!
Author

Sunshine Profits Investment Araştırma Ekibi
Sunshine Profits
Sunshine Profits Investment, emtia ve kıymetli metallerin uzun vadeli trendlerini belirleme, düşük riskli giriş noktaları belirleme ve potansiyel tepe noktalarının oluşumunu tahmin etme üstünde yoğunlaşarak bu konuda analiz ve str


