Gold: Bearish targets met, structure turns — FVG compression at 4,540 sets up the week

1. Macro and fundamental backdrop
The macro story shifted this week. Reports of a tentative 60 day ceasefire extension between the US and Iran — designed to create space for formal peace talks — triggered a sharp recovery in gold from its weekly lows. Trump has not yet signed off on the agreement, and CENTCOM confirmed the ceasefire remains ongoing despite a fresh exchange of fire during the week. The situation is advancing, not resolved. That distinction matters for positioning.
Rate expectations have stabilised. The Fed is expected to hold rates at 3.50 to 3.75% at the June meeting — CME FedWatch shows a 98.1% probability of no change. With the energy inflation premium from the Iran conflict beginning to deflate as oil eases, the hawkish case for a rate hike by year end has softened. That repricing gave gold a fundamental reason to bid.
Dollar (DXY):
The DXY remains in a descending channel. A fading energy inflation narrative reduces the structural urgency behind dollar strength. Gold at current levels benefits directly from that dynamic.
Central bank demand:
The World Gold Council reported 244 tonnes in Q1 2026 purchases, up 3% year on year. That demand is policy driven, not reactive to headlines. It sets the structural floor regardless of what the peace talks deliver in the near term.
Gold is caught between a fading conflict premium and an emerging ceasefire tailwind. The direction of the next meaningful leg depends on whether the peace framework holds — and whether the US jobs data due this week gives the Fed any reason to change its stance.
2. Technical structure — 4H primary timeframe
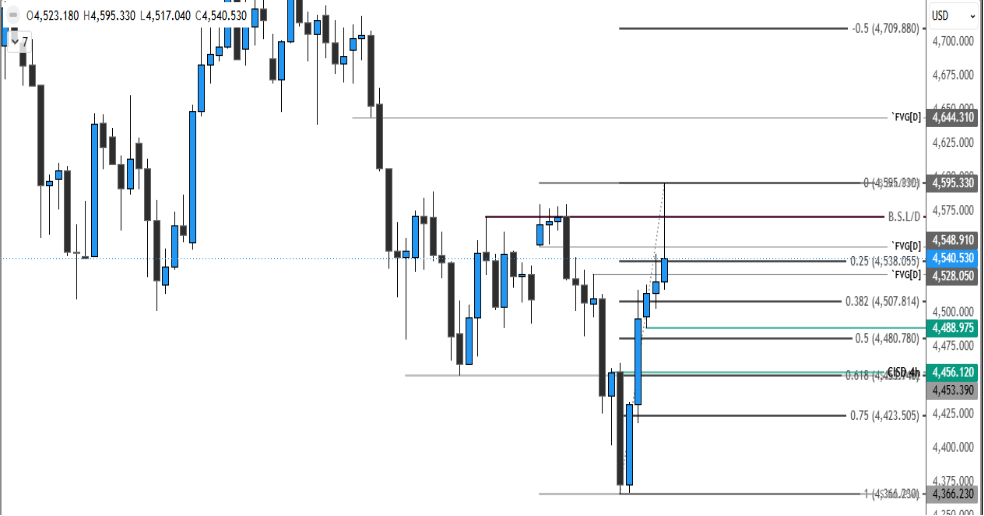
Gold is compressing inside a daily bearish FVG between 4,528.05 and 4,548.91, sitting at a decision point after the sharpest recovery of the past six weeks. The structure has shifted.
The bearish thesis from the May 17 and May 23 outlooks ran to completion this week. Price delivered both primary targets: the 61.8% Fibonacci retracement of the 4,099.12 to 4,891.54 swing at 4,401.82, and the 200 day EMA at 4,377.15. Those levels absorbed the selling. What followed was not a technical bounce — it was an institutional reversal triggered by the peace deal headline, with enough momentum to sweep the buy side liquidity above 4,589.58 (the prior week's high).
That sweep matters. It tells you that buyers coming off the 61.8 fib and the 200 day EMA had enough conviction to take out the entire prior week's highs. The failure to then close above the daily bearish FVG between 4,528.05 and 4,548.91 is the one incomplete piece. Price pulled back into the FVG and is compressing there now. A daily close above 4,548.91 confirms FVG acceptance and opens 4,595.33. A rejection below 4,528.05 sets up the retracement toward the Fibonacci pullback levels.
The Fibonacci retracement of the full recovery swing — from 4,366.23 to 4,595.33 — gives two clearly defined reactive long zones: 0.5 at 4,480.78 and 0.618 at 4,453.39. A pullback to either of those levels before the continuation is the base case.
Market structure summary:
- Prior bearish targets achieved: 4,401.82 (61.8% fib) and 4,377.15 (200 day EMA)
- Structural reversal: Buy side sweep above 4,589.58 confirms institutional demand off the lows
- Current compression: Price inside FVG between 4,528.05 and 4,548.91
- Directional trigger up: Daily close above 4,548.91 opens 4,595.33
- Directional trigger down: Daily close below 4,528.05 opens pullback to 4,480.78 and 4,453.39
- Structural invalidation: Daily close below 4,366.23
Level | Type | Significance |
4,709.88 | 0.5 Extension — Upside Target | Extended bullish objective above the recovery swing origin. Activated on a sustained break and close above 4,644.31. |
4,644.31 | Daily Bearish FVG — Upper Edge | Upper boundary of the broader daily supply zone. Primary resistance above 4,595.33; target for the extended bullish leg. |
4,595.33 | 0 Level — Swing High (Recovery Origin) | Top of the 4,366.23 to 4,595.33 recovery swing. First clean resistance above the FVG. A daily close above this level opens the path toward 4,644.31. |
4,548.91 | B.S.L/D and FVG[D] Upper Edge | Buy side daily liquidity and the upper edge of the immediate bearish FVG. A daily close above this level confirms FVG acceptance and activates 4,595.33. |
4,540.53 | Current Price | Compressing inside the bearish FVG between 4,528.05 and 4,548.91. Decision zone entering the week. |
4,528.05 | FVG[D] Lower Edge | Floor of the immediate daily bearish FVG. A daily close below this level signals rejection of the FVG and opens the pullback toward 4,480.78. |
4,507.81 | 0.382 Fibonacci | Minor Fibonacci reference within the retracement structure. Weak support; not a primary entry zone. |
4,480.78 | 0.5 Fibonacci — First Pullback Zone | 50% retracement of the 4,366.23 to 4,595.33 swing. Primary reactive long zone on any pullback from current levels. |
4,453.39 | 0.618 Fibonacci — Deeper Pullback Zone | 61.8% retracement and prior weekly structural low. Secondary reactive long zone; holds confluence with the prior S.S.L/PWL. |
4,423.51 | 0.75 Fibonacci | Deep retracement reference. A move here suggests bearish pressure is stronger than expected; reassess the bullish case at this level. |
4,366.23 | 1.0 Level — Swing Low and Invalidation Floor | Origin of the recovery swing and structural base. A daily close below this level invalidates the current bullish thesis entirely. |
3. Key zone analysis
The immediate zone is the daily bearish FVG between 4,528.05 and 4,548.91. Price swept liquidity above 4,589.58 and pulled back into this gap. The question entering the week is whether price closes above 4,548.91 — confirming the FVG has absorbed as demand — or rejects from inside it and begins the retracement sequence.
If the FVG holds as demand and price closes above 4,548.91, the 4,595.33 level is the first resistance. Above that, the upper daily FVG zone between 4,584.38 and 4,644.31 becomes the next supply reference. Both need to be cleared for the extended target at 4,709.88 to become relevant.
On the pullback side, 4,480.78 (0.5 fib of the 4,366.23 to 4,595.33 swing) is the primary reactive long zone. A deeper move tests 4,453.39 (0.618 fib and the prior weekly structural low). Both levels hold confluence — reactive longs at either zone, confirmed by a 4H bullish rejection candle, are the highest probability entries for the bullish continuation. Neither is chased without confirmation.
4. Scenario based trade framework
Scenario 1 — Bullish continuation (primary bias)
Trigger: Pullback to 4,480.78 (0.5 fib) or 4,453.39 (0.618 fib) holds and produces a bullish 4H rejection candle, followed by a daily close back above 4,528.05. Alternatively: a direct daily close above 4,548.91 without a meaningful pullback.
Expected path: 4,540 → pullback to 4,480.78 or 4,453.39 → recovery above 4,548.91 → 4,595.33 → 4,644.31 → 4,709.88
- Entry: Reactive long at 4,480.78 or 4,453.39 on 4H bullish confirmation candle. Or break and retest of 4,548.91 on a direct move higher.
- T1: 4,595.33 — top of the current recovery swing
- T2: 4,644.31 — upper edge of the broader daily bearish FVG
- T3: 4,709.88 — 0.5 extension of the 4,366.23 to 4,595.33 swing
- Stop: Below 4,453.39 on the 0.5 fib entry. Below 4,420 on the 0.618 fib entry.
Scenario 2 — Deeper retracement before continuation (reactive)
Trigger: Price breaks below 4,453.39 (0.618 fib) but holds above 4,423.51 (0.75 fib). The broader bullish structure above 4,366.23 remains intact.
Expected path: 4,540 → 4,453.39 → 4,423.51 → recovery toward 4,480.78 and then 4,548.91
- Execution: Reactive long at 4,423.51 on a strong 4H bullish reversal candle, confirmed by a daily close back above 4,453.39.
- T1: 4,480.78 — minor resistance at the prior pullback level
- T2: 4,548.91 — FVG upper edge and the key acceptance level
- Stop: Below 4,400 — approaching the 4,366.23 invalidation zone.
Scenario 3 — Bullish invalidation (low probability)
Trigger: A daily close below 4,366.23 — the origin of the recovery swing and the structural base of the current bullish thesis.
Structural consequence: A close below 4,366.23 signals the rally from the 61.8 fib was corrective, not structural. The broader bearish sequence resumes and sub-4,300 levels come back into scope.
- Entry logic: Do not short on an intraday break. Wait for a daily close below 4,366.23, then a bearish rejection candle on retest of that level from below.
- T1: 4,300 — psychological and structural reference below the swing origin
- T2: Reassessment of the full 4,099.12 to 4,891.54 swing; deeper Fibonacci levels below 4,300 become relevant
- Stop: Above 4,400 on the retest entry — a recovery back above that level signals the break was false.
- Probability: Low. The confluence of the 61.8% fib at 4,401.82 and the 200 day EMA at 4,377.15 absorbed significant selling this week. A second break of that zone requires a major macro shock — ceasefire collapse, a hawkish Fed surprise at the June meeting, or an inflation print that resets rate hike expectations entirely.
5. Risk events and catalysts — Week of 1 June 2026
June 1 — Manufacturing PMI and Powell remarks
A below 50 PMI reading confirms demand destruction and softens the rate hike case, supporting gold. Powell's first public remarks since leaving the Chair role will be parsed for any commentary that nuances the Warsh transition or the inflation outlook.
June 3 — ADP employment and services PMI
ADP is the labour market preview before Friday's NFP. A services PMI above 50 keeps the resilient growth narrative intact, which supports the dollar and limits gold's upside bandwidth into the week's close.
June 5 — NFP and unemployment rate
The week's defining print. A weak NFP below 100K combined with a rising unemployment rate opens the door to a shift in rate expectations toward eventual easing — directly bullish for gold. A strong print reinforces higher for longer and caps the recovery.
US and Iran peace deal (ongoing)
The 60 day ceasefire extension is in progress but unsigned. Trump's approval accelerates the oil decline, eases inflation expectations further, and supports gold's path toward 4,644 and beyond. A collapse in talks puts the energy inflation narrative back on the table and threatens the current structural shift.
6. Summary and directional bias
Gold has completed its bearish sequence and reversed. Price is now compressing inside the daily FVG at 4,528.05 to 4,548.91 — sitting at the pivot that determines whether the continuation trades directly higher or sets up a pullback entry first. The prior bearish targets at 4,401.82 and 4,377.15 were hit and absorbed. The buy side sweep above 4,589.58 confirmed institutional demand off those lows.
The base case is a pullback to 4,480.78 or 4,453.39 before the next leg higher toward 4,595.33 and 4,644.31. Both Fibonacci levels hold reactive long setups provided the daily close confirmation arrives. The bullish thesis stays intact above 4,366.23. Below it, the entire recovery is reclassified.
BULLISH ABOVE | NEUTRAL BETWEEN | BEARISH BELOW |
4,528.05 FVG accepted as demand; path open toward 4,595 → 4,644 | 4,453.39 – 4,528.05 Pullback range; await reaction at 0.5 or 0.618 fib before entry | 4,366.23 Bullish thesis invalidated; bearish structure resumes |
Author

Martin Nwankwo
TradingPRO
Technical Market analyst with over a decade of forex experience, an ICT chartered student.














