Gold
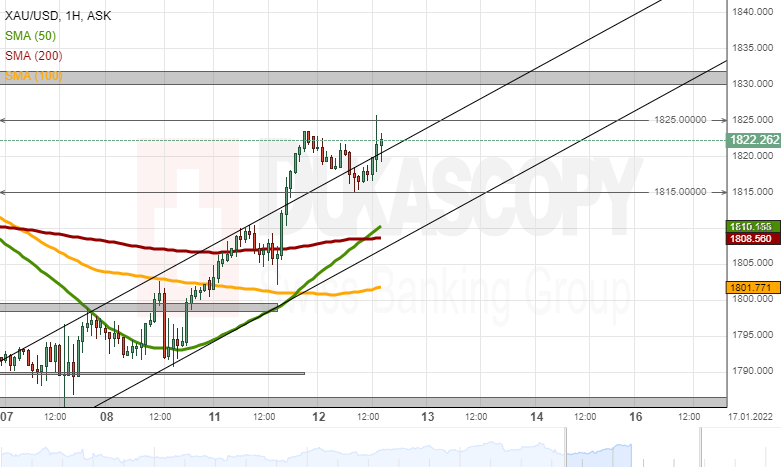
The price for gold surged faster than expected, as the bullion broke through the upper trend line of the channel up pattern and reached the 1,823.50 level on Tuesday. Afterward, a consolidation down to the 1,815.00 level occurred. The 1,815.00 acted as support and started a surge.
On Wednesday, at 13:30 GMT, the US Consumer Price Index and Core Consumer Price index data was released. The USD reacted by declining. On the bullion charts the move was observed as a test of the resistance of the 1,825.00 mark. By large, it can be observed that the price respects round price levels.
If the price for gold continue to surge, the bullion would most likely encounter resistance in 1,825.00. The surge could eventually end at the summer high-level zone that starts at 1,830.00. On the other hand, a decline would need to pass the 1,815.00 mark, before reaching the 50 and 200-hour simple moving averages at 1,810.00.
This overview can be used only for informational purposes. Dukascopy SA is not responsible for any losses arising from any investment based on any recommendation, forecast or other information herein contained.
Recommended Content
Editors’ Picks
AUD/USD regains the constructive outlook above the 200-day SMA
AUD/USD advanced strongly for the second session in a row, this time extending the recovery to the upper 0.6500s and shifting its focus to the weekly highs in the 0.6580-0.6585 band, an area coincident with the 100-day SMA.
EUR/USD keeps the bullish performance above 1.0700
The continuation of the sell-off in the Greenback in the wake of the FOMC gathering helped EUR/USD extend its bounce off Wednesday’s lows near 1.0650, advancing past the 1.0700 hurdle ahead of the crucial release of US NFP on Friday.
Gold stuck around $2,300 as market players lack directional conviction
Gold extended its daily slide and dropped below $2,290 in the second half of the day on Thursday. The benchmark 10-year US Treasury bond yield erased its daily losses after US data, causing XAU/USD to stretch lower ahead of Friday's US jobs data.
Bitcoin price rises 5% as BlackRock anticipates a new wave of capital inflows into BTC ETFs from investors
Bitcoin (BTC) price slid to the depths of $56,552 on Wednesday as the cryptocurrency market tried to front run the Federal Open Market Committee (FOMC) meeting. The flash crash saw millions in positions get liquidated.
FOMC in the rear-view mirror – NFP eyed
The update from May’s FOMC rate announcement proved more dovish than expected, which naturally weighed on the US dollar (sending the DXY to lows of 105.44) and US yields, as well as, initially at least, underpinning major US equity indices.