GBP/USD drives down a slippery road, EUR/JPY seems to be looking for downside correction [Video]
![GBP/USD drives down a slippery road, EUR/JPY seems to be looking for downside correction [Video]](https://editorial.fxstreet.com/images/Markets/Currencies/Crosses/EURJPY/computer-keyboard-with-currency-pair-eur-jpy-button-49017434_XtraLarge.jpg)
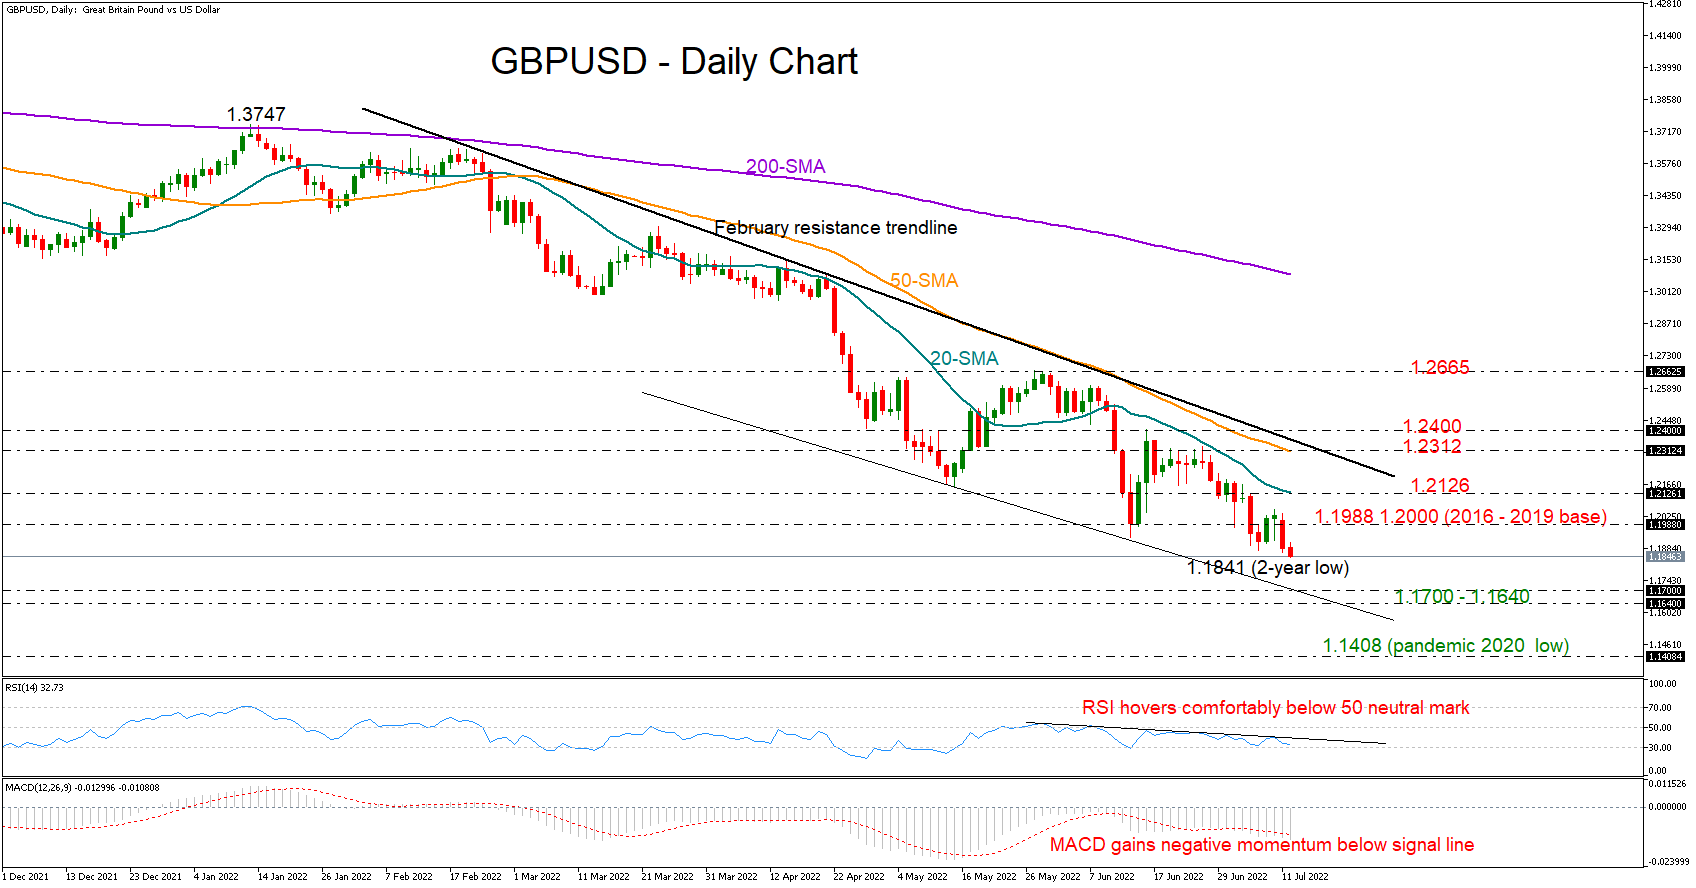
GBP/USD drives down a slippery road; 1.1700 next in focus
GBPUSD could not close successfully above the 1.1988 – 1.2000 bar last week, which had proven to be a reliable support base between 2016 and 2019, with the price erasing its latest bullish attempt to chart a new two-year low at 1.1844 early on Tuesday.
The market is lacking conviction for a meaningful bounce back as the RSI keeps hovering comfortably below its 50 neutral mark, while the MACD is displaying stronger bearish dynamics, extending its negative trajectory below its red signal line.
Hence, the base scenario is for the one-year-old downtrend to see further continuation, likely testing the tentative support line somewhere between 1.1700 and 1.1640, with the latter representing the 161.8% Fibonacci extension of the latest upside correction. If the bears snap that floor, the next destination will be the pandemic 2020 bottom of 1.1408.
In the event of an upside reversal, the pair may re-challenge the 1.1988 – 1.2000 ceiling before meeting the 20-day simple moving average (SMA) at 1.2132. Another advance from here could last until the 1.2300 zone, where the 50-day SMA and the resistance trendline from February reside. Should the bulls reclaim the previous high of 1.2400 as well, the recovery may pick up steam towards May’s high of 1.2665.
Summarizing, downside forces are expected to dominate in the coming sessions, with traders likely looking for support within the 1.1700 – 1.1640 region.
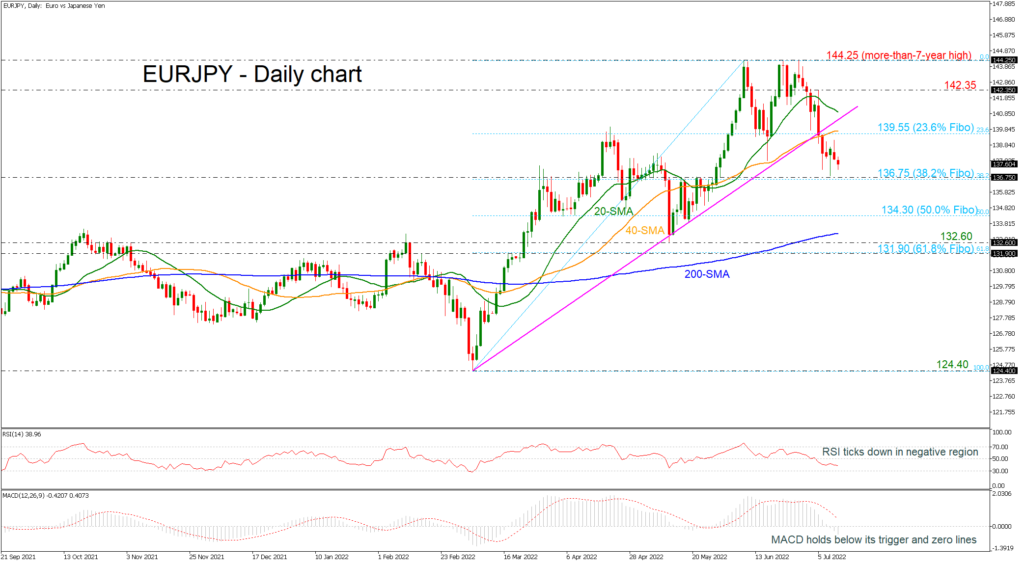
EUR/JPY seems to be looking for downside correction after 7-year highs
EURJPY is tumbling below the medium-term ascending trend line, changing the bullish outlook to neutral. The RSI is sloping downwards in the negative region, while the MACD is losing momentum below its trigger and zero lines. In trend indicators, the 20-day simple moving average (SMA) is turning lower, approaching the 40-day SMA for a possible bearish cross.
If sellers sink deeper, than the price may meet the 38.2% Fibonacci retracement level of the up leg from 124.40 to 144.25 at 136.75. Steeper declines under the line would have to tackle a more durable support section from the 50.0% Fibonacci at 134.30 and the 200-day SMA at 133.18. Extending lower could encounter the 132.60 barrier and the 61.8% Fibonacci at 131.90, shifting the outlook to bearish.
On the other hand, if buying interest picks up, early tough resistance could occur at the 23.6% Fibonacci of 139.55, where the 40-day SMA also resides. A violation of this level may shoot the pair to challenge the 20-day SMA at 141.00 ahead of 142.35. Even higher, the price may surge towards the more-than-seven-year peak of 144.25.
Overall, the very near-term picture remains negative below the ascending line; however, in the bigger picture, a bearish outlook may come only if there were a break below the 200-day SMA.
Author

Christina joined the XM investment research department in May 2017. She holds a master degree in Economics and Business from the Erasmus University Rotterdam with a specialization in International economics.


