GBP/USD recovers amid UK inflation data: Positive signals emerge

GBP/USD was trading at 1.3428 on Thursday, following a period of volatility after the release of UK inflation data, which came in weaker than expected despite geopolitical tensions over Iran and rising oil prices.
The UK Consumer Price Index (CPI) slowed to 2.8% in April, down from 3.3% in March, while the market had anticipated a reading of 3%.
The market interpreted these figures as a signal that the Bank of England may not need to raise interest rates aggressively in the near term. This has reduced expectations of further tightening and weighed on the pound.
Weak labour market data in the UK added to the negative sentiment. Recent statistics indicated a slowdown in hiring and a decline in new vacancies, reflecting the impact of the broader economic environment.
It is important to note that the effect of slower inflation may be temporary. Since the onset of the Iran conflict, global oil prices have increased by approximately 50%, and this rise is likely to feed into the UK economy and consumer prices over time.
Technical analysis
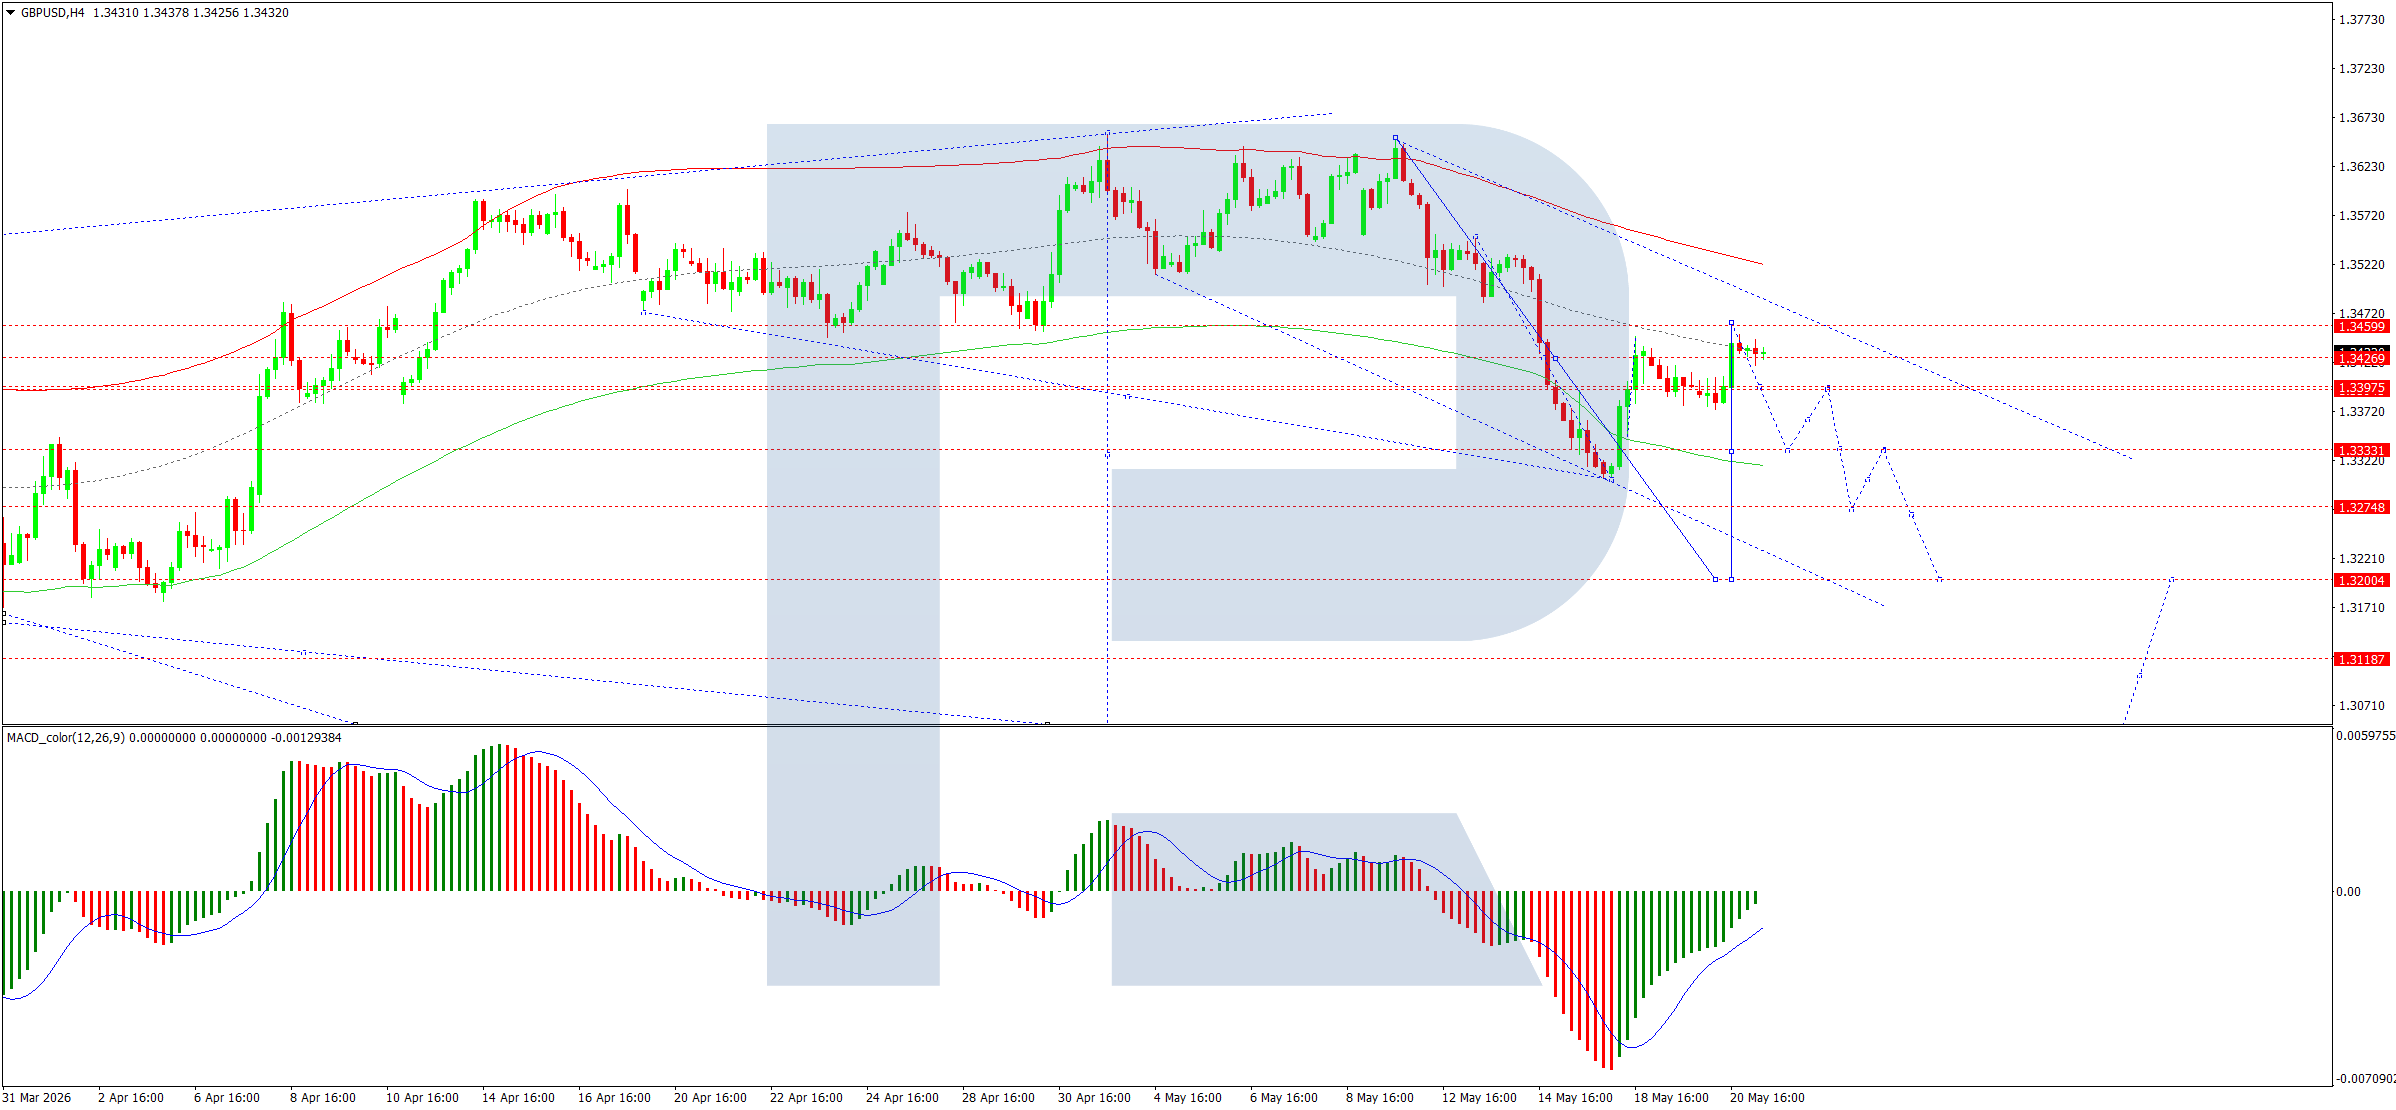
On the H4 GBP/USD chart, the pair is trading within a broad consolidation range above 1.3388, currently extending up to 1.3490. A move lower towards 1.3380 is likely. After this, the pair may consolidate, with potential to move to 1.3515 on the upside or decline towards 1.3200 on the downside. The MACD indicator supports this scenario, with the signal line below zero and pointing firmly downwards.
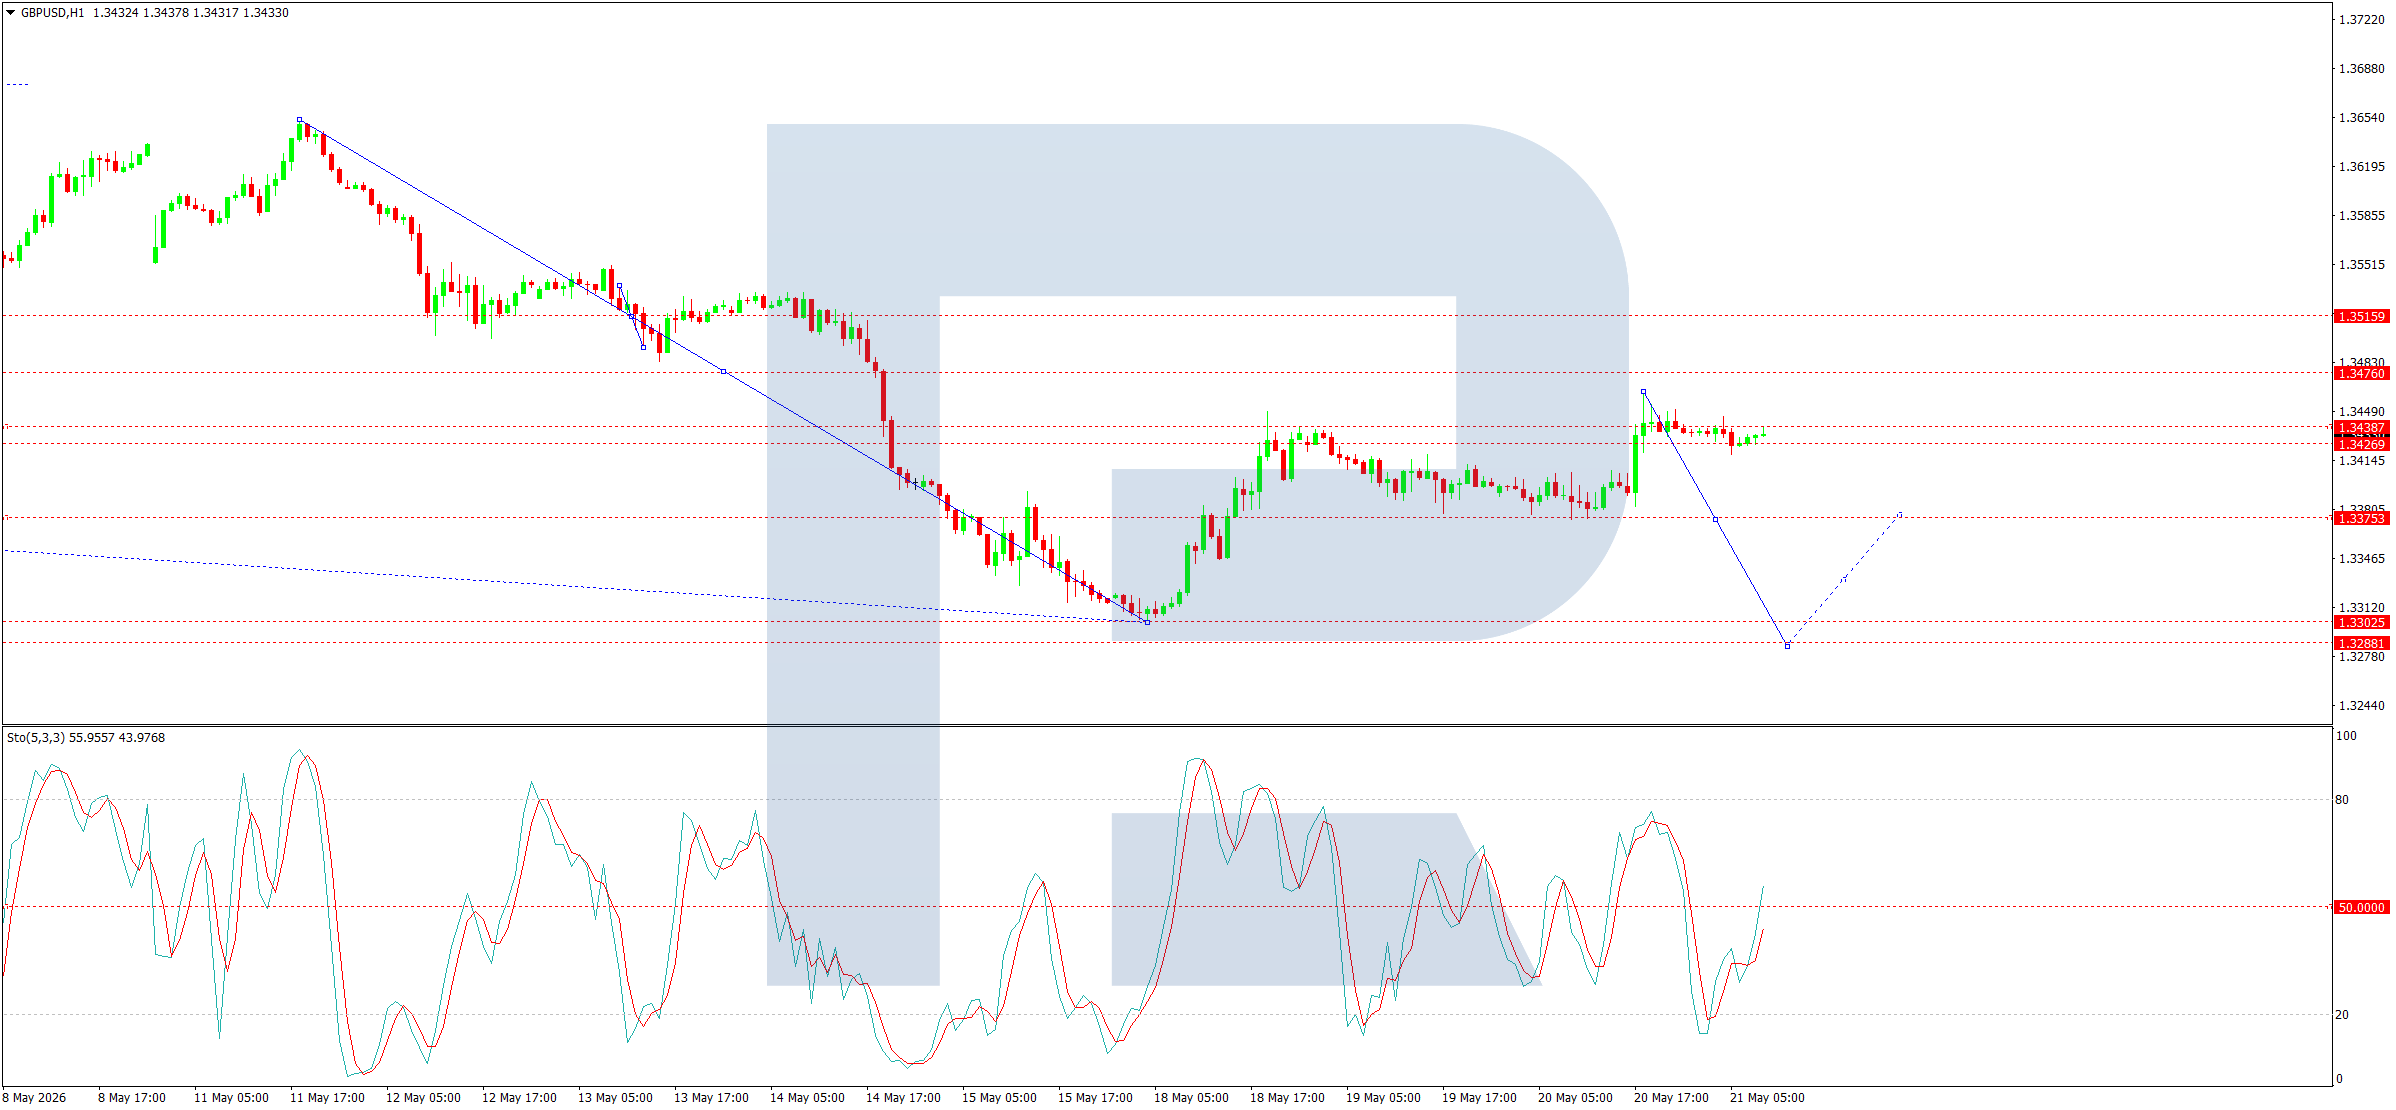
On the H1 chart, GBP/USD is trading within a compact consolidation range around 1.3434, currently extending up to 1.3464. A move lower towards 1.3333 is possible. The Stochastic oscillator confirms this scenario, with its signal line below 50 and pointing firmly downwards towards 20.
Conclusion
GBP/USD stabilised following weaker-than-expected UK inflation data, easing concerns about aggressive Bank of England rate hikes. However, the pound faces headwinds from a soft labour market and rising oil prices, suggesting that any recovery may be short-lived. Technical indicators point to a near-term correction before a potential continuation of the broader trend.
Author

RoboForex Analysis Department
RoboForex
RoboForex Analysis Department provides timely market insights, expert technical analysis, and actionable forecasts across forex, commodities, indices, and equities.