|

GBP/USD path of least resistance is down, 1.2870 targeted — Confluence Detector

The GBP/USD is under pressure as the US Dollar gains strength across the board and worries about Brexit consume the Conservative Party. Where next for the Pound? Recovering may be hard, and falling is more natural.

The Technical Confluences Indicator shows that Sterling has noteworthy support only at 1.2984 where we see the confluence of the Fibonacci 61.8% one-month and the Simple Moving Average 50 one-day. 

Lower, a feeble cushion awaits at 1.2950 which is the confluence of two Pivot Points: the one-day Support 2 and the one-week Support 1.

Significant support is only at 1.2870 which is where the Bollinger Band one-day Lower and the Pivot Point one-week Support 2 converge.

Looking up, resistance is considerable. At 1.3038 we see a dense cluster of lines including the Simple Moving Average 5-one-hour, the SMA 504h, the Bollinger Band 15m-Middle, the Fibonacci 23.6% one-day, the SMA 50-15m, the BB 1h-Middle, the SMA 200-15m, and the SMA 50-1h. 

The path higher is filled with substantial caps peaking at 1.3106 which is the congestion of the SMA 5 one-day, the SMA 100-4h, the PP one-day R1, and the all-important Fibonacci 38.2% one-month.

All in all, the path of least resistance is down.

This is how it looks on the tool:
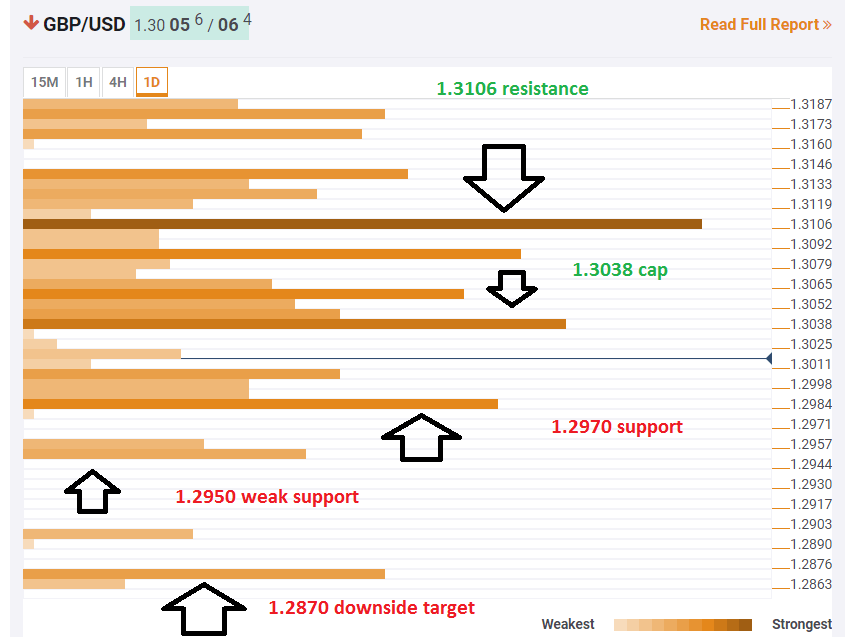
GBPUSD confluence October 2 2018 technical

Confluence Detector

The Confluence Detector finds exciting opportunities using Technical Confluences. The TC is a tool to locate and point out those price levels where there is a congestion of indicators, moving averages, Fibonacci levels, Pivot Points, etc. Knowing where these congestion points are located is very useful for the trader, and can be used as a basis for different strategies.

This tool assigns a certain amount of “weight” to each indicator, and this “weight” can influence adjacents price levels. This means that one price level without any indicator or moving average but under the influence of two “strongly weighted” levels accumulate more resistance than their neighbors. In these cases, the tool signals resistance in apparently empty areas.

Learn more about Technical Confluence

Author

Yohay Elam

Yohay Elam

FXStreet

Yohay is in Forex since 2008 when he founded Forex Crunch, a blog crafted in his free time that turned into a fully-fledged currency website later sold to Finixio.


More from Yohay Elam
Share:

Editor's Picks

AUD/USD rises to 0.6950 as USD slips on Fed's Warsh

AUD/USD regains traction and extends the bounce toward 0.6950 in the Asian session on Friday. Fed Chair Warsh's comments reinforce the selling pressure on the US Dollar, allowing the pair to stretch higher. Warsh said that he remains committed to delivering price stability without giving away anything on future interest rate path.

USD/JPY falls in symc with USD, gives up 158.00 after Warsh's speech

USD/JPY has come under fresh selling pressure and gives up 158.00 in the Asian session on Friday amid the emergence of fresh US Dollar selling. Fed Chair Warsh's non-committal commentary on the future tightening path, weighs on the US Dollar and the pair.

Gold looks vacillating above $4,150

Gold alternates gains with losses below the key $4,200 mark per troy ounce on Friday. The yellow metal’s irresolute price action comes in response to a modest pullback in the US Dollar and a tepid recovery in US Treasury yields across the board.

Bitcoin steadies at $82,000: The five forces crushing the Uptober rally

Crypto markets have remained under pressure so far in October, with Bitcoin (BTC) sliding below $80,000 earlier this week before recovering to around $82,000 on Friday, as macroeconomic headwinds and cooling demand weigh on the market.

The Fed just got a second hot inflation number. Here's what the diesel signal is really saying
The Federal Reserve (Fed) faces a renewed inflation challenge after two consecutive reports showed price pressure intensifying across the US economy. September's Consumer Price Index (CPI) confirmed accelerating consumer inflation, while the Producer Price Index (PPI) revealed an even sharper rise in business costs. Behind both reports lies a common factor: energy prices.
Everyone's dumping Gold after hot US inflation. Here's why $4,100 could be a floor, not a cliff
Gold (XAU/USD) is recovering from a sharp sell-off triggered by hotter-than-expected United States (US) inflation data released on Wednesday. The precious metal briefly plunged toward $4,073 as investors increased their bets on further Federal Reserve (Fed) interest rate hikes before recovering as US Treasury yields and the US Dollar (USD) reversed their initial gains.















