GBP/USD Forecast: Pound closes in on key resistance above 1.2600
- GBP/USD has managed to shake off the bearish pressure.
- Renewed dollar weakness helps the pair push higher on Thursday.
- April Pending Home Sales data from the US could have an impact on risk perception.

GBP/USD has gathered bullish momentum on Thursday and climbed above 1.2600. The pair was last seen testing the key resistance level located near 1.2620 and a four-hour close above that level could be taken as a bullish sign.
The selling pressure surrounding the greenback is helping GBP/USD push higher. The US Dollar Index stays in negative territory below 102.00 in the European trading hours as US Treasury bond yields extend the weekly slide toward 2.7%.
On Wednesday, the minutes of the FOMC's May policy meeting showed that policymakers saw it appropriate for the US central bank to hike its policy rate by a total of 100 basis points at the next two policy meetings. The publication didn't offer any details surrounding the Fed's balance sheet reduction plan but revealed that participants saw inflation risks skewed to the upside.
In the second half of the day, April Pending Home Sales data from the US will be watched closely by market participants. The market consensus points to a 2% decline in April and a bigger-than-forecast drop could cause investors to seek refuge. Although the British pound is likely to have a difficult time finding demand in that scenario, another leg lower in US yields should limit the pair's downside
In the meantime, the market reaction to the political jitters in the UK remains muted for the time being. Two lawmakers from Prime Minister Boris Johnson's Conservative Party announced that they pulled their support over the 'partygate' scandal. In case political tensions continue to rise in the UK, the pound could struggle to continue to gather strength.
GBP/USD Technical Analysis
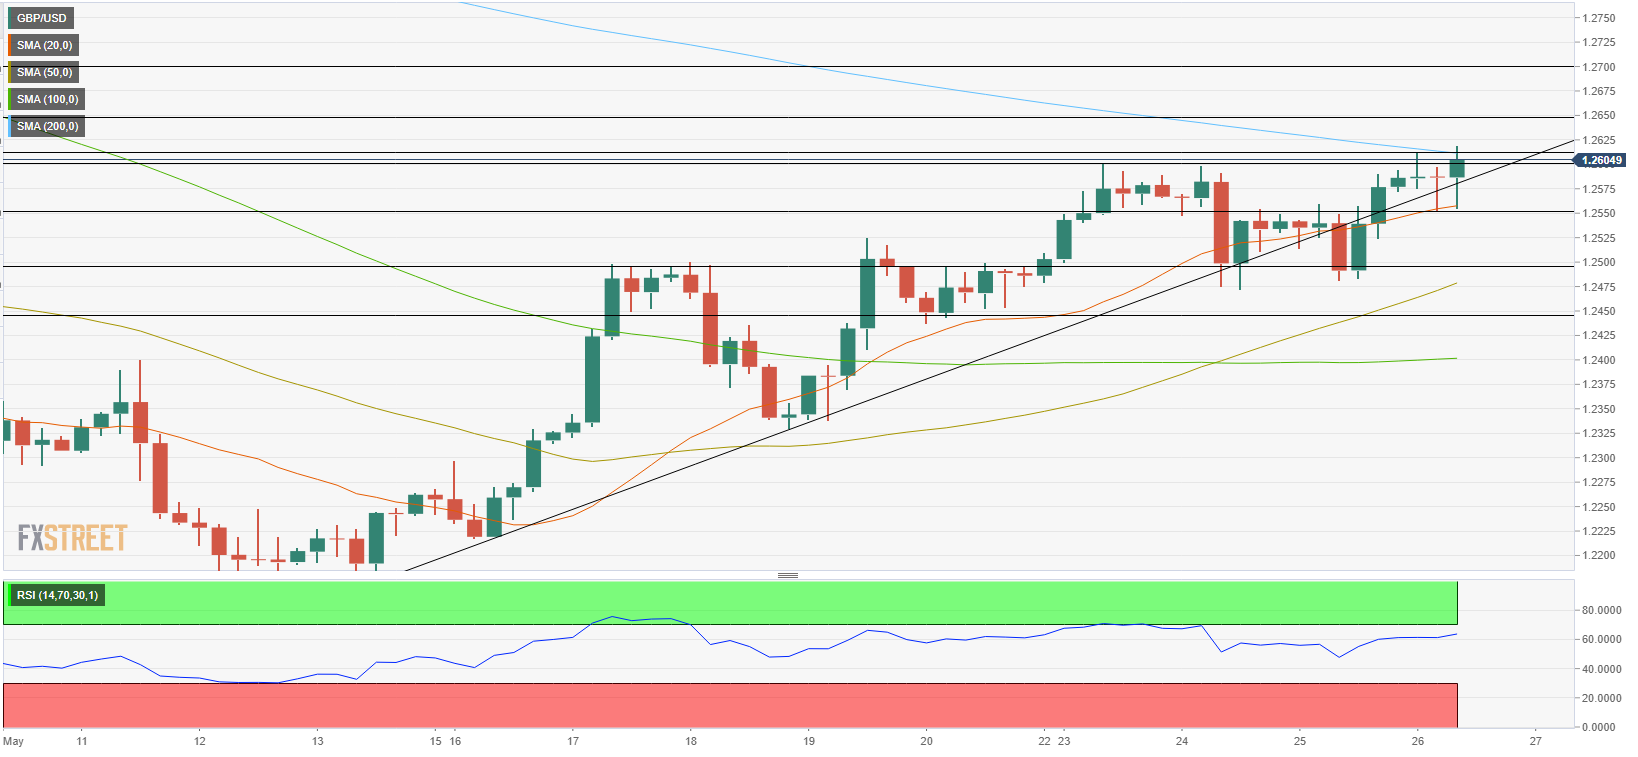
The Relative Strength Index (RSI) indicator on the four-hour chart rose above 60, suggesting that buyers retain control of the pair's action. In case GBP/USD rises above 1.2620 (200-period SMA) and confirms that level as support, additional gains toward 1.2650 (static level) and 1.2700 (psychological level) could be witnessed.
On the flip side, the ascending trend line coming from mid-May forms significant support at 1.2600. When the pair dropped below that line earlier in the week, it lost 50 pips before reclaiming it. Hence, a four-hour close below 1.2600 could force buyers to move to the sidelines and cause the pair to drop toward 1.2550 (20-period SMA) and 1.2500 (psychological level, static level).
Premium
You have reached your limit of 3 free articles for this month.
Start your subscription and get access to all our original articles.
Author

Eren Sengezer
FXStreet
As an economist at heart, Eren Sengezer specializes in the assessment of the short-term and long-term impacts of macroeconomic data, central bank policies and political developments on financial assets.


