GBP/USD ends the month with Its worst performance in a year

The GBP/USD pair continued to decline against the US dollar on Friday and is set to close June with its worst monthly performance since July last year, trading near 1.3182. Since the start of the month, sterling has lost around 2.2%. Current levels are the lowest since November last year.
Several factors are weighing on the British currency. First, lower oil prices following the easing of tensions between the US and Iran have reduced inflation risks and lowered the likelihood of more aggressive rate hikes by the Bank of England. The market now expects only one rate increase before the end of the year, compared with two that were priced in just a few weeks ago.
Domestic UK politics has become an additional source of uncertainty. Following the resignation of Prime Minister Keir Starmer, investors are awaiting the appointment of a new head of government and, most importantly, a new finance minister. Andy Burnham is seen as the most likely successor, although the composition of the future government’s economic team remains unclear.
The market is closely watching the new cabinet’s staffing decisions. These appointments will shape the country’s future fiscal policy and influence investor sentiment towards British assets.
Technical analysis
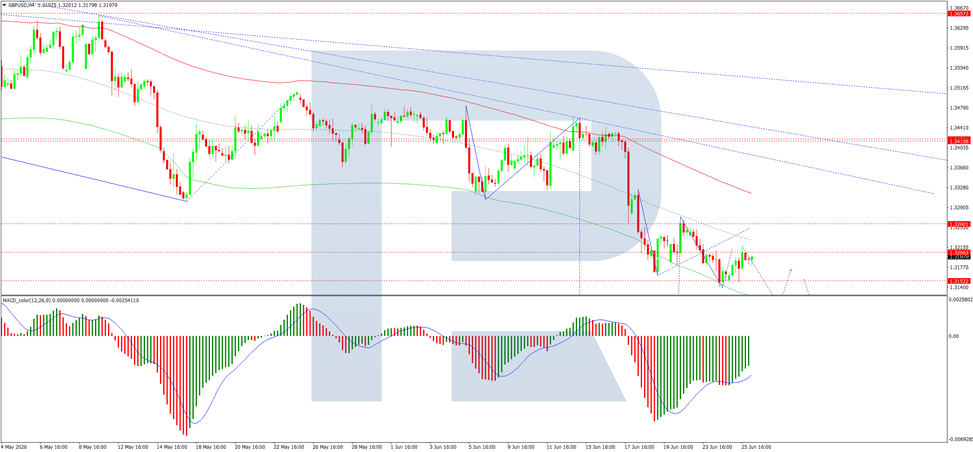
On the H4 chart of GBP/USD, the market completed a downward wave to 1.3140 and a growth wave towards 1.3217. In practice, a wide consolidation range is forming around 1.3200.
If the pair breaks out of this range to the upside, the potential will open for the wave to continue towards 1.3240. If the pair breaks out to the downside, the potential will open for a continuation of the decline towards 1.3033.
Technically, this scenario is confirmed by the MACD indicator. Its signal line is below the zero mark and is pointing firmly downwards.
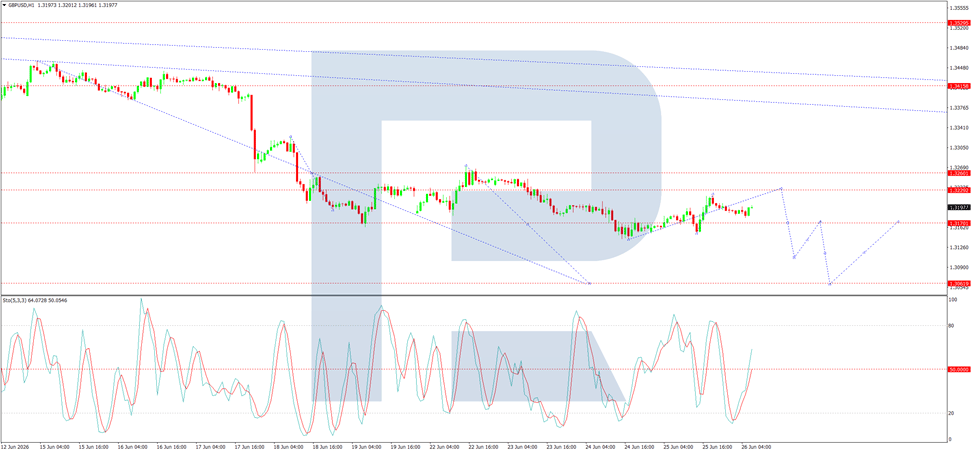
On the H1 chart, GBP/USD formed a compact consolidation range around 1.3180. At the moment, the range has expanded downwards to 1.3140. Further growth towards 1.3220 is expected, followed by a decline to 1.3060.
The Stochastic oscillator also supports this scenario. Its signal line is below 50 and is pointing firmly downwards towards 20.
Author

RoboForex Analysis Department
RoboForex
RoboForex Analysis Department provides timely market insights, expert technical analysis, and actionable forecasts across forex, commodities, indices, and equities.
















