|

GBP/USD Bullish Reversal after Bearish Trend Reaches 1.31?

Meta description: GBP/USD made another low but closed and reversed after reaching 1.31. The GU showed strong bullish momentum which could indicate a larger bullish move.

GBPUSD

GBP/USD

4 hour

GBPUSD

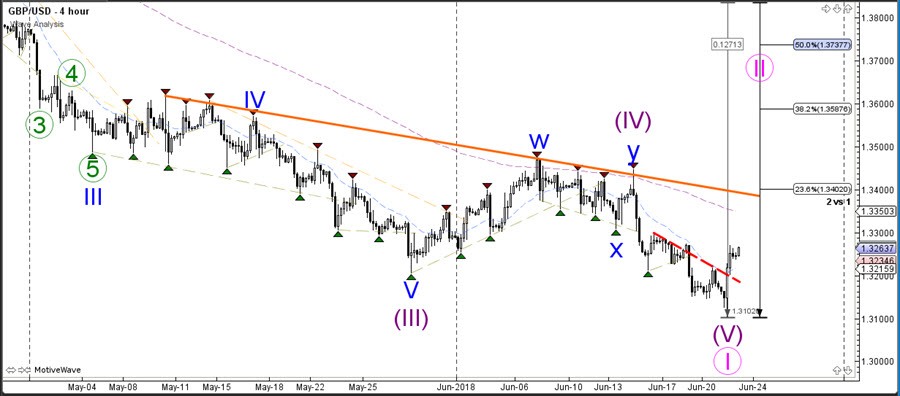
The GBP/USD made another low but closed and reversed after reaching 1.31. The GU showed strong bullish momentum as it broke above the resistance trend line which could indicate a larger bullish move.

The GBP/USD might have completed a potential wave 5 of a larger wave 1, which could kick off a larger bullish correction in wave 2.

1 hour

GBPUSD

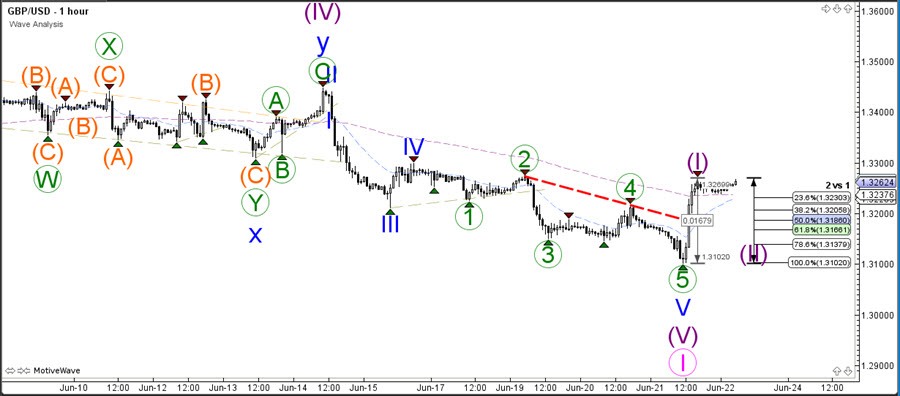
The GBP/USD bullish correction could develop via a wave 1-2 (purple) pattern. The wave 2 is invalidated if price breaks below the bottom of wave 2 (the 100% Fibonacci level).

Author

Chris Svorcik

Chris Svorcik

Elite CurrenSea

Experience Chris Svorcik has co-founded Elite CurrenSea in 2014 together with Nenad Kerkez, aka Tarantula FX. Chris is a technical analyst, wave analyst, trader, writer, educator, webinar speaker, and seminar speaker of the financial markets.

More from Chris Svorcik
Share:

Editor's Picks

EUR/USD tests nine-day EMA support near 1.1850

EUR/USD inches lower during the Asian hours on Monday, trading around 1.1870 at the time of writing. The 14-day Relative Strength Index momentum indicator at 56 stays above the midline, confirming improving momentum. RSI has cooled from prior overbought readings but stabilizes above 50, suggesting dips could stay limited before buyers reassert control.

GBP/USD flat lines as traders await key UK macro data and FOMC minutes

The GBP/USD pair kicks off a new week on a subdued note and oscillates in a narrow range, just below mid-1.3600s, during the Asian session. Moreover, the mixed fundamental backdrop warrants some caution for aggressive traders as the market focus now shifts to this week's important releases from the UK and the US.

Gold slides below $5,000 amid USD uptick and positive risk tone; downside seems limited

Gold attracts fresh sellers at the start of a new week and reverses a part of Friday's strong move up of over $150 from sub-$4,900 levels. The commodity slides back below the $5,000 psychological mark during the Asian session, though the downside potential seems limited amid a combination of supporting factors.

Bitcoin, Ethereum and Ripple consolidate within key ranges as selling pressure eases

Bitcoin and Ethereum prices have been trading sideways within key ranges following the massive correction. Meanwhile, XRP recovers slightly, breaking above the key resistance zone. The top three cryptocurrencies hint at a potential short-term recovery, with momentum indicators showing fading bearish signs.

Global inflation watch: Signs of cooling services inflation

Realized inflation landed close to expectations in January, as negative base effects weighed on the annual rates. Remaining sticky inflation is largely explained by services, while tariff-driven goods inflation remains limited even in the US.

Ripple Price Forecast: XRP potential bottom could be in sight

Ripple edges up above the intraday low of $1.35 at the time of writing on Friday amid mixed price actions across the crypto market. The remittance token failed to hold support at $1.40 the previous day, reflecting risk-off sentiment amid a decline in retail and institutional sentiment.