GBP/USD: a Battle between Triple Top Resistance and Double Top Support

GBP/USD has produced a Tweezer Top at the resistance of a Triple Top on the daily chart. The chart had a mixed day yesterday having a strong bounce. This made the daily candle close with a long lower shadow. However, considering the strength of the resistance, the chart suggests that the price may head towards the last swing low, which is the support of a Double Top.
Chart 1 GBP/USD Daily Chart
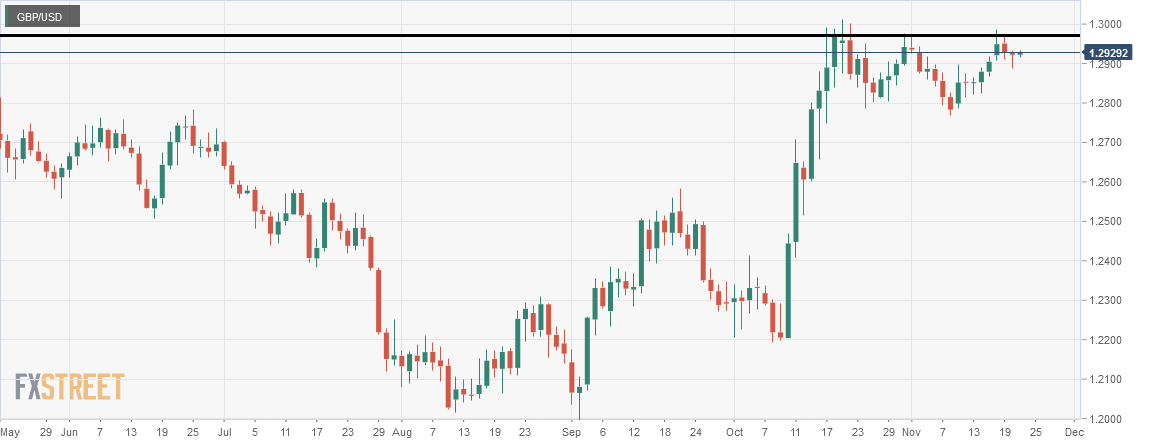
The chart shows that the price had rejection at the level of 1.29500 three times. At the last rejection, it produced Tweezer Top. This is a strong bearish reversal candle. However, yesterday, the price did not move towards the South as expected. It rather ended up being a bullish Pin Bar. Since the candle did not form at a buying zone, so it may not attract the buyers of the daily chart. The sellers, on the other hand, may go short below yesterday’s lowest low. The price may find its support at the level of 1.2800.
Today’s intraday price action has been bullish. On the H4 chart, it has been having an upward correction. The sellers are to wait for a bearish reversal candle to go short on the pair.
Chart 2 GBP/USD H4 Chart
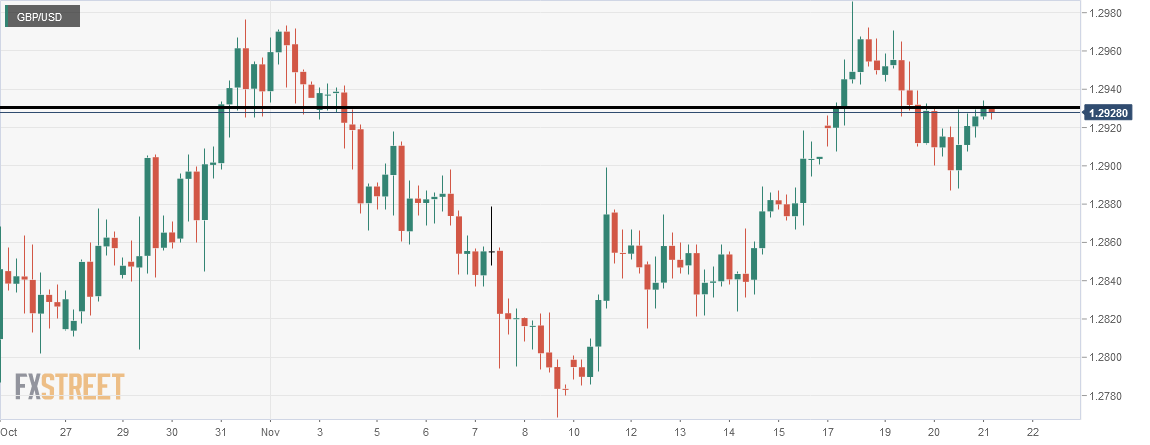
The price after making a bearish move has been moving towards the upside. It is roaming around the level of 1.29280, which is a key level. If the level holds the price and produces an H4 bearish reversal candle, minor intraday charts’ traders may start selling the pair. Eventually, the price may head towards the level of 1.2990 in a hurry. That selling pressure may make a breakout at yesterday’s lowest low and drive the price towards the South further with more selling pressure.
Chart 3 GBP/USD H1 Chart
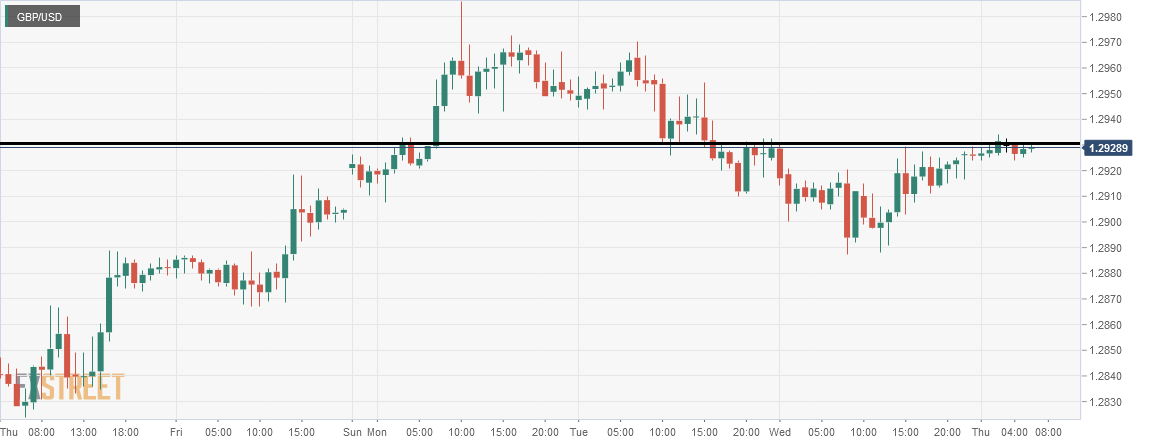
The H1 chart shows that the price action has been choppy. The resistance level has been able to hold the price for quite a few hours. Yesterday’s lowest low is far away for the H1 chart to make a downside breakout. Thus, the H1 chart trader shall flip over to the minor chart to go short upon an H1 strong bearish reversal candle. For the buyers, it looks a bit better, though. An upside breakout, consolidation, and an H1 bullish reversal candle may push the price towards the level of 1.2970.
The daily and H4 charts look bearish biased. The H1 chart looks neutral. Thus, the sellers have the upper hand. They must not forget that the support of a Double Bottom is on their way.
Author

EagleFX Team
EagleFX
EagleFX Team is an international group of market analysts with skills in fundamental and technical analysis, applying several methods to assess the state and likelihood of price movements on Forex, Commodities, Indices, Metals and


