GBP/AUD Elliott Wave technical analysis [Video]
![GBP/AUD Elliott Wave technical analysis [Video]](https://editorial.fxstreet.com/images/Markets/Currencies/Majors/GBPUSD/money-pound-sterling-gm172795697-5997711_XtraLarge.jpg)
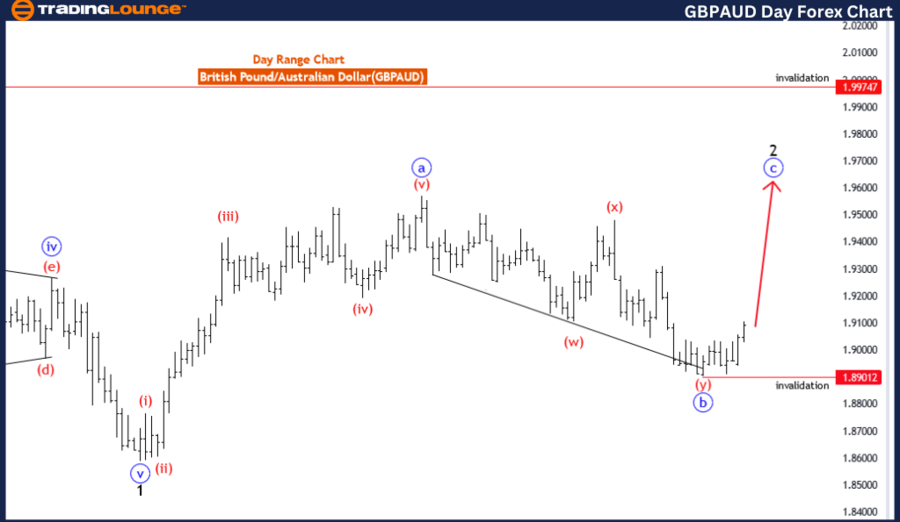
British Pound/ Australian Dollar (GBPAUD) Day Chart.
GBP/AUD Elliott Wave technical analysis
Function: Counter Trend
Mode: impulsive
Structure: Blue wave C
Postion: Black wave 2
Direction next lower degrees: Black wave 3
Details: Blue wave B of 2 looking completed , now blue wave C of 2 is in play.
Wave cancel invalid level: 1.99747
The Elliott Wave analysis for the British Pound/Australian Dollar (GBPAUD) on the daily chart provides insights into the current counter trend movements. The analysis identifies the mode as impulsive within the blue wave C structure, indicating a strong and definitive directional move that is typically seen in corrective phases.
The primary structure under scrutiny is blue wave C, with the current position marked within black wave 2. This positioning signifies that the currency pair is in the second wave of a corrective phase, progressing through the blue wave C sequence. This phase often entails a significant push in the market as part of a larger corrective pattern.
The analysis also highlights the next lower degree direction, which is black wave 3. This suggests that after the completion of the current wave, the market is expected to enter black wave 3, marking another impulsive move following the corrective phase.
Key details include the completion of blue wave B of 2, indicating that this corrective wave segment has concluded, and the market is now advancing into blue wave C of 2. This transition is crucial as it marks the onset of the next impulsive move within the corrective pattern, characterized by strong price action.
A critical aspect of this analysis is the wave cancel invalid level, set just below a specific threshold. If the market moves beyond this level, it would invalidate the current wave count and necessitate a reassessment of the wave structure, potentially indicating a shift in the market’s direction.
In summary, the Elliott Wave analysis for GBPAUD on the daily chart indicates a counter trend impulsive movement within blue wave C of black wave 2. With the completion of blue wave B, the market is now progressing into blue wave C. Monitoring the invalidation level is essential to track possible changes in market behavior and ensure the accuracy of the Elliott Wave pattern.
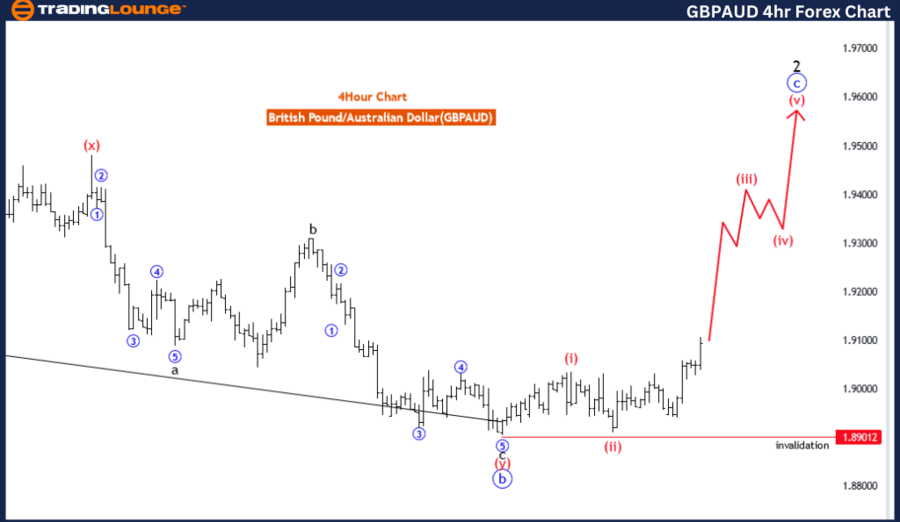
GBP/AUD four-hour chart
Function: Counter Trend.
Mode: Impulsive as C.
Structure: Red wave 3.
Position: Blue wave C
Direction next lower degrees: Red wave 4
Details: Red wave 2 of C looking completed at 1.89076 , now red wave 3 is in play . Wave Cancel invalid level: 1.89012
The Elliott Wave analysis for the British Pound/Australian Dollar (GBPAUD) on the 4-hour chart highlights the current market dynamics from a counter trend perspective. The analysis identifies the mode as impulsive within the context of wave C, suggesting a strong directional movement typically observed in corrective phases that follow an ABC pattern.
The primary wave structure in focus is red wave three, indicating that the currency pair is in the midst of a significant impulsive wave. The current position is identified within blue wave C, which is part of the larger red wave three sequence. This suggests that the market is experiencing a powerful move within the broader corrective wave pattern.
The direction for the next lower degrees is red wave four, indicating that following the completion of the current impulsive wave, a corrective phase (red wave four) is expected. This phase typically involves a retracement before the market continues in its overall trend direction.
Key details from the analysis include the completion of red wave two of C at a specific level. With this wave now completed, the market is advancing into red wave three. This transition marks the beginning of the next impulsive sequence, characterized by strong and directional price movements.
A critical aspect of this analysis is the wave cancel invalid level, set just below the completion level of red wave two. This level serves as a crucial threshold; if the market moves beyond this point, it would invalidate the current wave count. This would necessitate a reassessment of the wave structure and could indicate a potential shift in the market direction.
In summary, the Elliott Wave analysis for GBPAUD on the 4-hour chart indicates an ongoing counter trend impulsive movement within red wave three of blue wave C. With the completion of red wave two, the market is now progressing into red wave three. Monitoring the invalidation level is essential for tracking possible changes in the market’s behavior and ensuring the accuracy of the Elliott Wave pattern.
GBP/AUD Elliott Wave technical analysis [Video]
Author

Peter Mathers
TradingLounge
Peter Mathers started actively trading in 1982. He began his career at Hoei and Shoin, a Japanese futures trading company.


