Gold: FVG inverted, structure deteriorates — Fibs point toward 4,495 as the next reckoning

1. Macro and fundamental backdrop
Right now, the macro backdrop is working against gold. April CPI came in at 3.8% year on year; above the 3.7% consensus and well clear of the 3.3% prior. That is the largest monthly increase since 2023. Core CPI at 2.8% also topped estimates. Then PPI landed and confirmed the same story: wholesale inflation rising at its fastest pace since 2022. Two consecutive prints moving in the wrong direction are not statistical noise. Markets treated them exactly as they should, as a signal.
Rate cut expectations for 2026 are gone. The probability of a June cut sits below 3%. What stands out even more is that around 30% of market participants are now pricing in a rate hike by December, according to Prime Terminal data. US 10-year yields moved to 4.457% on the CPI release. The dollar firmed up, with DXY tagging five-day highs near 98.37. Rising real yields alongside a strengthening dollar — that is the most direct pressure gold faces at the moment.
Energy and geopolitics
The Strait of Hormuz situation sits beneath all of this as the inflation engine. WTI crude surged above $101 per barrel midweek after talks between the US and Iran broke down. Trump called Tehran's response to the peace proposal totally unacceptable and convened his national security council to assess military options. Energy driven inflation puts the Fed in an awkward spot in both directions — it pushes CPI higher and reduces the case for cuts, while also raising the cost of letting the conflict drag on. This is no longer a tail risk for gold. It is the operating environment.
Fed leadership
Kevin Warsh was confirmed to the Fed board this week. His vote as Chair is imminent: just two days before Powell's final day. Warsh is well known as a hawk. If his early tone reinforces the higher for longer message, which the current inflation data fully supports, rate expectations stay anchored well above the levels that historically carry gold rallies. The leadership change adds uncertainty, but not the kind gold benefits from right now.
Central bank demand — The structural floor
The one thing that has not moved is sovereign demand. Central banks are still accumulating at a pace that prevents a deep structural break in gold. Q1 2026 purchases came in 17% above the same period last year. India did tighten import regulations this week, which is a marginal headwind for physical demand. That structural floor is real, but it cannot, on its own, offset a strong dollar and the complete removal of rate cut expectations from the calendar.
The macro backdrop has moved from uncertain to clearly unfavorable for gold over the short to medium term. Until inflation prints start moving in the other direction, the dollar has a reason to stay bid — and gold has a reason to stay under pressure.
2. Technical structure — Four-hour primary timeframe
Eight days ago, this analysis called the bullish structure shift at 4,660.28 as the floor for a run toward 4,833. That floor is gone. Price did not hold the Market Structure Shift level. The daily bullish FVG at 4,668.78, reclaimed two weeks ago as confirmation of the bull case; has been inverted. What was demand is now supply. That flip is the single most important development on this chart.
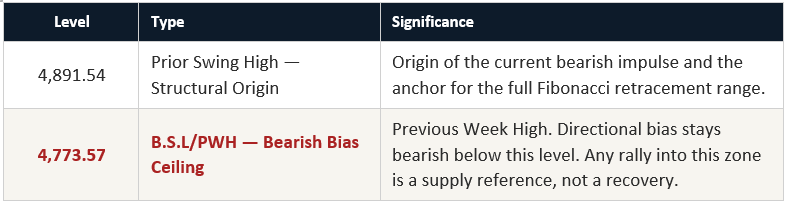
The sequence from the week of May 5 makes the picture clear. Price rallied to 4,773.57, the B.S.L/PWH, got rejected at exactly that level, and then sold off aggressively across five sessions to close the week at 4,540.64. The weekly candle printed a high of 4,773.57 and a low of 4,510.98 — a 2636-point range that belongs entirely to the sell side. Price is now sitting just above the SSL cluster at 4,510.98 and 4,501.03. The pressure is not ambiguous.
The 61.8% Fibonacci retracement of the swing from 4,891.54 to 4,501.35 comes in at 4,742.36. Price reversed from 4,773.57.
Market structure summary
- Prior bullish thesis: Market structure shift on the daily, reclaim at 4,660.28, FVG close at 4,667.33, target 4,833.23.
- Invalidation event: Daily close below 4,660.58 — daily bullish FVG inverted, structure broken.
- Current structure: Lower High confirmed at 4,773.57; price pressing the SSL cluster at 4,510 and 4,501.
- Directional bias: Bearish below 4,773.57; primary target 4,495.33.
3. Key zone analysis
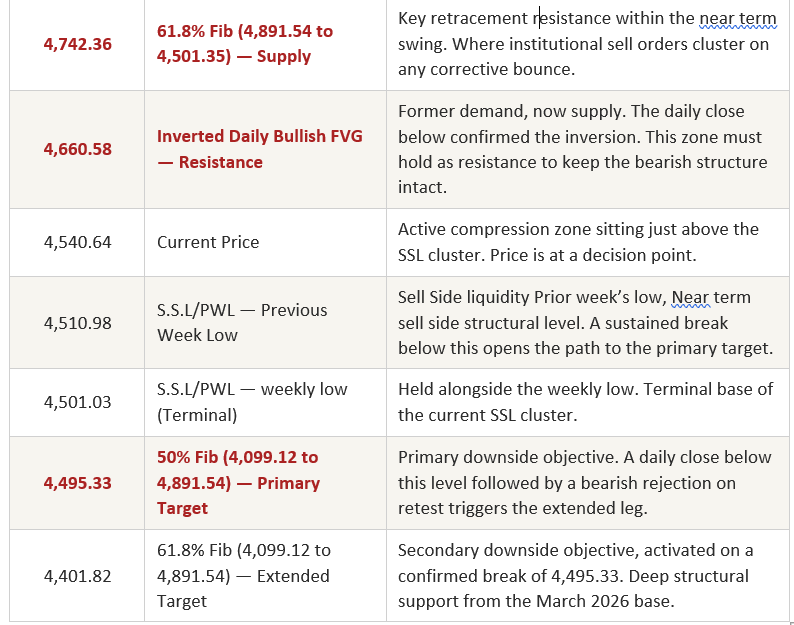
The inverted daily bullish FVG at 4,660.58 is the zone that matters most right now. It was previously the structural confirmation of the bullish shift. Now that price has closed below it on the daily, any rally back into the 4,648 to 4,668 range should be read as supply, not support. The market has repriced it. A retest of 4,660.58 that produces a bearish rejection candle on the daily or 4H — a bearish engulfing, a shooting star, a strong close back below the zone — is the cleanest short setup in the current framework.
Below current price, the key decision point is the SSL cluster: 4,510.98 and 4,501.03. Price visited this zone during the April sweep and bounced. A second test of the same liquidity pool does not usually produce the same outcome. If price closes below 4,501.03 on the daily, the 50% Fibonacci retracement of the full 4,099.12 to 4,891.54 swing at 4,495.33 is the next draw. Pay close attention to how any bounce from these levels behaves. A weak, low volume reaction followed by a daily close below 4,501 is the confirmation the bears need.
4. Scenario-based trade framework
Scenario 1: Bearish continuation (Primary Bias)
Trigger: Price fails to hold a daily close above 4,510.98, or rallies briefly and gets rejected at the inverted FVG zone between 4,648 and 4,668. The bearish move continues with no structural recovery.
Expected path: 4,540 → 4,501.03 (SSL cluster breach) → 4,495.33 (50% Fib) → 4,401.82 (61.8% Fib, extended leg)
- Entry logic: Short on a 4H bearish rejection from the 4,648 to 4,668 inverted FVG zone, confirmed by a bearish close. Or short on a daily close below 4,501.03 using a retest entry.
- T1: 4,495.33; 50% Fibonacci retracement of the 4,099.12 to 4,891.54 swing
- T2: 4,401.82; 61.8% Fibonacci retracement; extended target on a confirmed daily close below 4,495.33
- Stop: Above 4,668 on the FVG entry. Above 4,520 on the SSL break entry.
Scenario 2: Corrective rally /Liquidity hunt (Reactive)
Trigger: Price bounces from the 4,501 to 4,510 SSL cluster and rallies back toward the 4,648 to 4,668 inverted FVG, or stretches further into the 4,742.36 Fibonacci supply zone.
Expected move: A corrective rally within the broader bearish structure. Not a reversal. Price reaches supply, rejects, and resumes lower.
- Execution: No longs here unless price reclaims 4,773.57 on a daily close. If that happens, the entire bearish thesis needs to be reassessed.
- Primary value: Watch whether the rally stops at 4,660.58 or extends to 4,742.36. That tells you how strong the bears actually are and where to enter shorts for Scenario 1.
- Do not chase: A bounce from the SSL cluster without bearish confirmation at supply is not an entry.
Scenario 3: Bullish invalidation of bearish thesis
Trigger: A daily close above 4,773.57, reclaiming the Previous Week High. That level is the structural ceiling of the entire current bearish framework.
Structural consequence: A close above 4,773.57 breaks the Lower High formation. The bearish thesis is off the table and the path toward 4,833.23, then the April high at 4,891.54, reopens.
- What to watch: A daily close above 4,773.57 is the only condition that forces a full reassessment. Below it, rallies are selling opportunities.
- Probability: Low given the current macro setup — rising yields, a bid dollar, hot inflation prints, and an incoming Fed Chair with a hawkish track record. A sustained recovery above 4,773 is a stretch from here.
5. Risk events and catalysts — Week of 19 May 2026
May 20 — FOMC Minutes
The May meeting minutes will be read closely for any sign that a rate hike was formally discussed, even as a minority view. If it was, the dollar strengthens and gold faces immediate pressure. If the committee still sounds data dependent and split, some short-term relief is possible. Better to let the release confirm direction before positioning around it.
May 21 — Initial Jobless Claims and Manufacturing/Services PMI
A meaningful rise in claims introduces the stagflation real inflation still elevated, labor market slowing. That is a mixed signal for gold because it historically supports the metal but also supports the dollar. The more useful number is PMI. A reading below 50 in manufacturing is evidence of demand destruction, which eventually brings the Fed back toward easing and provides medium term support for gold.
May 22 — University of Michigan Inflation Expectations
Consumer inflation expectations have been running above the Fed's comfort level. A further increase keeps the hawkish stance in place. A pullback from elevated readings is the first real signal that inflation psychology is starting to anchor — modestly positive for gold, more positive for broader risk assets.
US and Iran Military Risk (Ongoing)
With the national security council actively assessing military options and oil already above $101, any escalation would spike energy prices, push CPI expectations higher, and produce a short term haven bid for gold even inside a broader bearish structure. Size positions accordingly. A ceasefire, on the other hand, would take oil lower and remove one of the core inflation arguments, adding downside pressure on gold.
6. Summary and directional bias
The technical picture has changed materially since last week's outlook. The bullish Market Structure Shift that anchored the early May setup has been taken out. The daily bullish FVG at 4,660.58 is now inverted resistance. The Previous Week High at 4,773.57 capped the rally and produced a sharp five session decline that leaves price compressed above the SSL cluster at 4,510.98 and 4,501.03.
The macro backdrop has moved in the same direction. April CPI at 3.8% has cleared the calendar of any rate cut expectations for 2026 and introduced a credible probability of a hike before year end. Kevin Warsh as incoming Chair is not expected to soften that message. The Strait of Hormuz situation keeps energy inflation alive and feeding directly into CPI. Central bank demand remains a structural anchor — but it is not strong enough to offset this combination of forces on its own.
The primary setup: price breaks the 4,501 to 4,510 SSL cluster, closes below 4,495.33 on the daily, and a subsequent rejection on retest confirms the move toward 4,401.82. Patience matters here — wait for the daily close confirmation, not the intraday break.

Author

Martin Nwankwo
TradingPRO
Technical Market analyst with over a decade of forex experience, an ICT chartered student.