FOMC to hold the line – Eyes on the guidance/dots

Following the Reserve Bank of Australia (RBA) standing pat on rates and the Bank of Japan (BoJ) raising its Policy Rate by 10bps, consequently putting a cap on NIRP, as well as ending YCC, the focus shifts to today’s FOMC rate decision at 6:00 pm GMT.
Fed funds rate to remain at 5.25%-5.50%
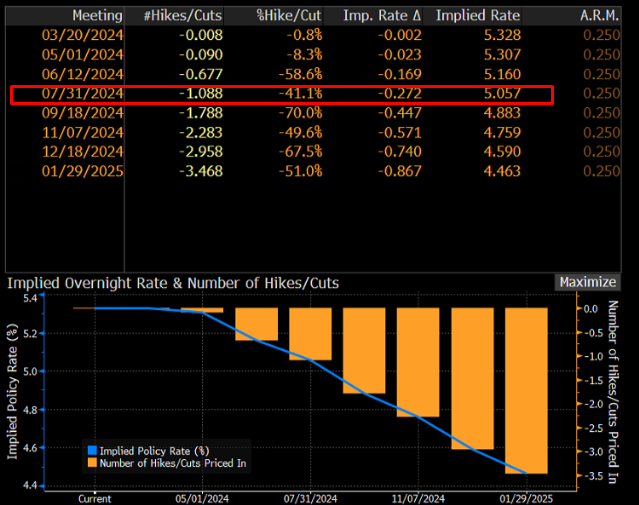
It is widely expected that the Fed will maintain its current benchmark lending rate between 5.25% and 5.50% for the fifth consecutive meeting. Not only has the Fed openly telegraphed that it has no interest in adjusting rates today, markets are also fully pricing in a no-change. Investors, however, are leaning towards the July meeting for the first 25bp cut (though June is still on the table [-17bps]) with a total of nearly three 25bp cuts for the year (-74bps of easing). As you may recall, at the start of the year, this was not the case; markets were forecasting more than six 25bp rate cuts at one point, which was clearly not what the Fed had in mind.
It is all in the dots
As a result of the above, today’s attention will be directed toward the Summary of Economic Projections (SEP) and the language (guidance) in the accompanying Rate Statement relating to future policy moves. The question for many will be whether we see the Fed raise its projections for growth and inflation and how this will affect their view regarding policy easing. Since the last FOMC meeting, inflation numbers have heated up. Both CPI and PPI inflation were higher than economists’ expectations at the headline level (YoY) for February (headline CPI inflation has been stabilising around the 3.0% mark since October 2023 [sticky]), with MoM headline measures (Jan-Feb) showing a beat in PPI data and CPI coming in as expected. Adding to this, the economy remains resilient, unemployment is low, employment growth is still robust and we have had weak jobless claims. However, retail sales are sluggish. As you can see, the economic picture remains uncertain, meaning the Fed will want to maintain some flexibility regarding the timing of a move in rates and is unlikely to offer limited information to investors.
Economists anticipate that the Fed will repeat its projections for December (2023). Nevertheless, if Powell and Co anticipate inflation to remain sticky, then the dot plot—FOMC participants’ assessments of appropriate monetary policy: midpoint of target range or target level for the Fed funds rate—could see a change to reflect this. This could mean that we see the dot plot revised to two rate cuts this year, which would likely fuel USD demand and show a hawkish repricing in rates; the last dot plot showed that Fed officials project three rate cuts for 2024. As a point of note, it would only take two out of the 19 Fed officials to alter their rate projection to downshift to two rate cuts. Some desks also project an upward revision in growth and PCE core inflation.
We are also likely to see the Fed repeat the need for further evidence on slowing inflation and that no action will be taken until it has ‘more confidence’ in inflation moving sustainably to the inflation target of 2.0%. It would also not raise too many eyebrows if the Fed Chair Jerome Powell echoed a cautious stance in his Press Conference thirty minutes after the rate announcement.
Dollar Index testing the mettle of resistance
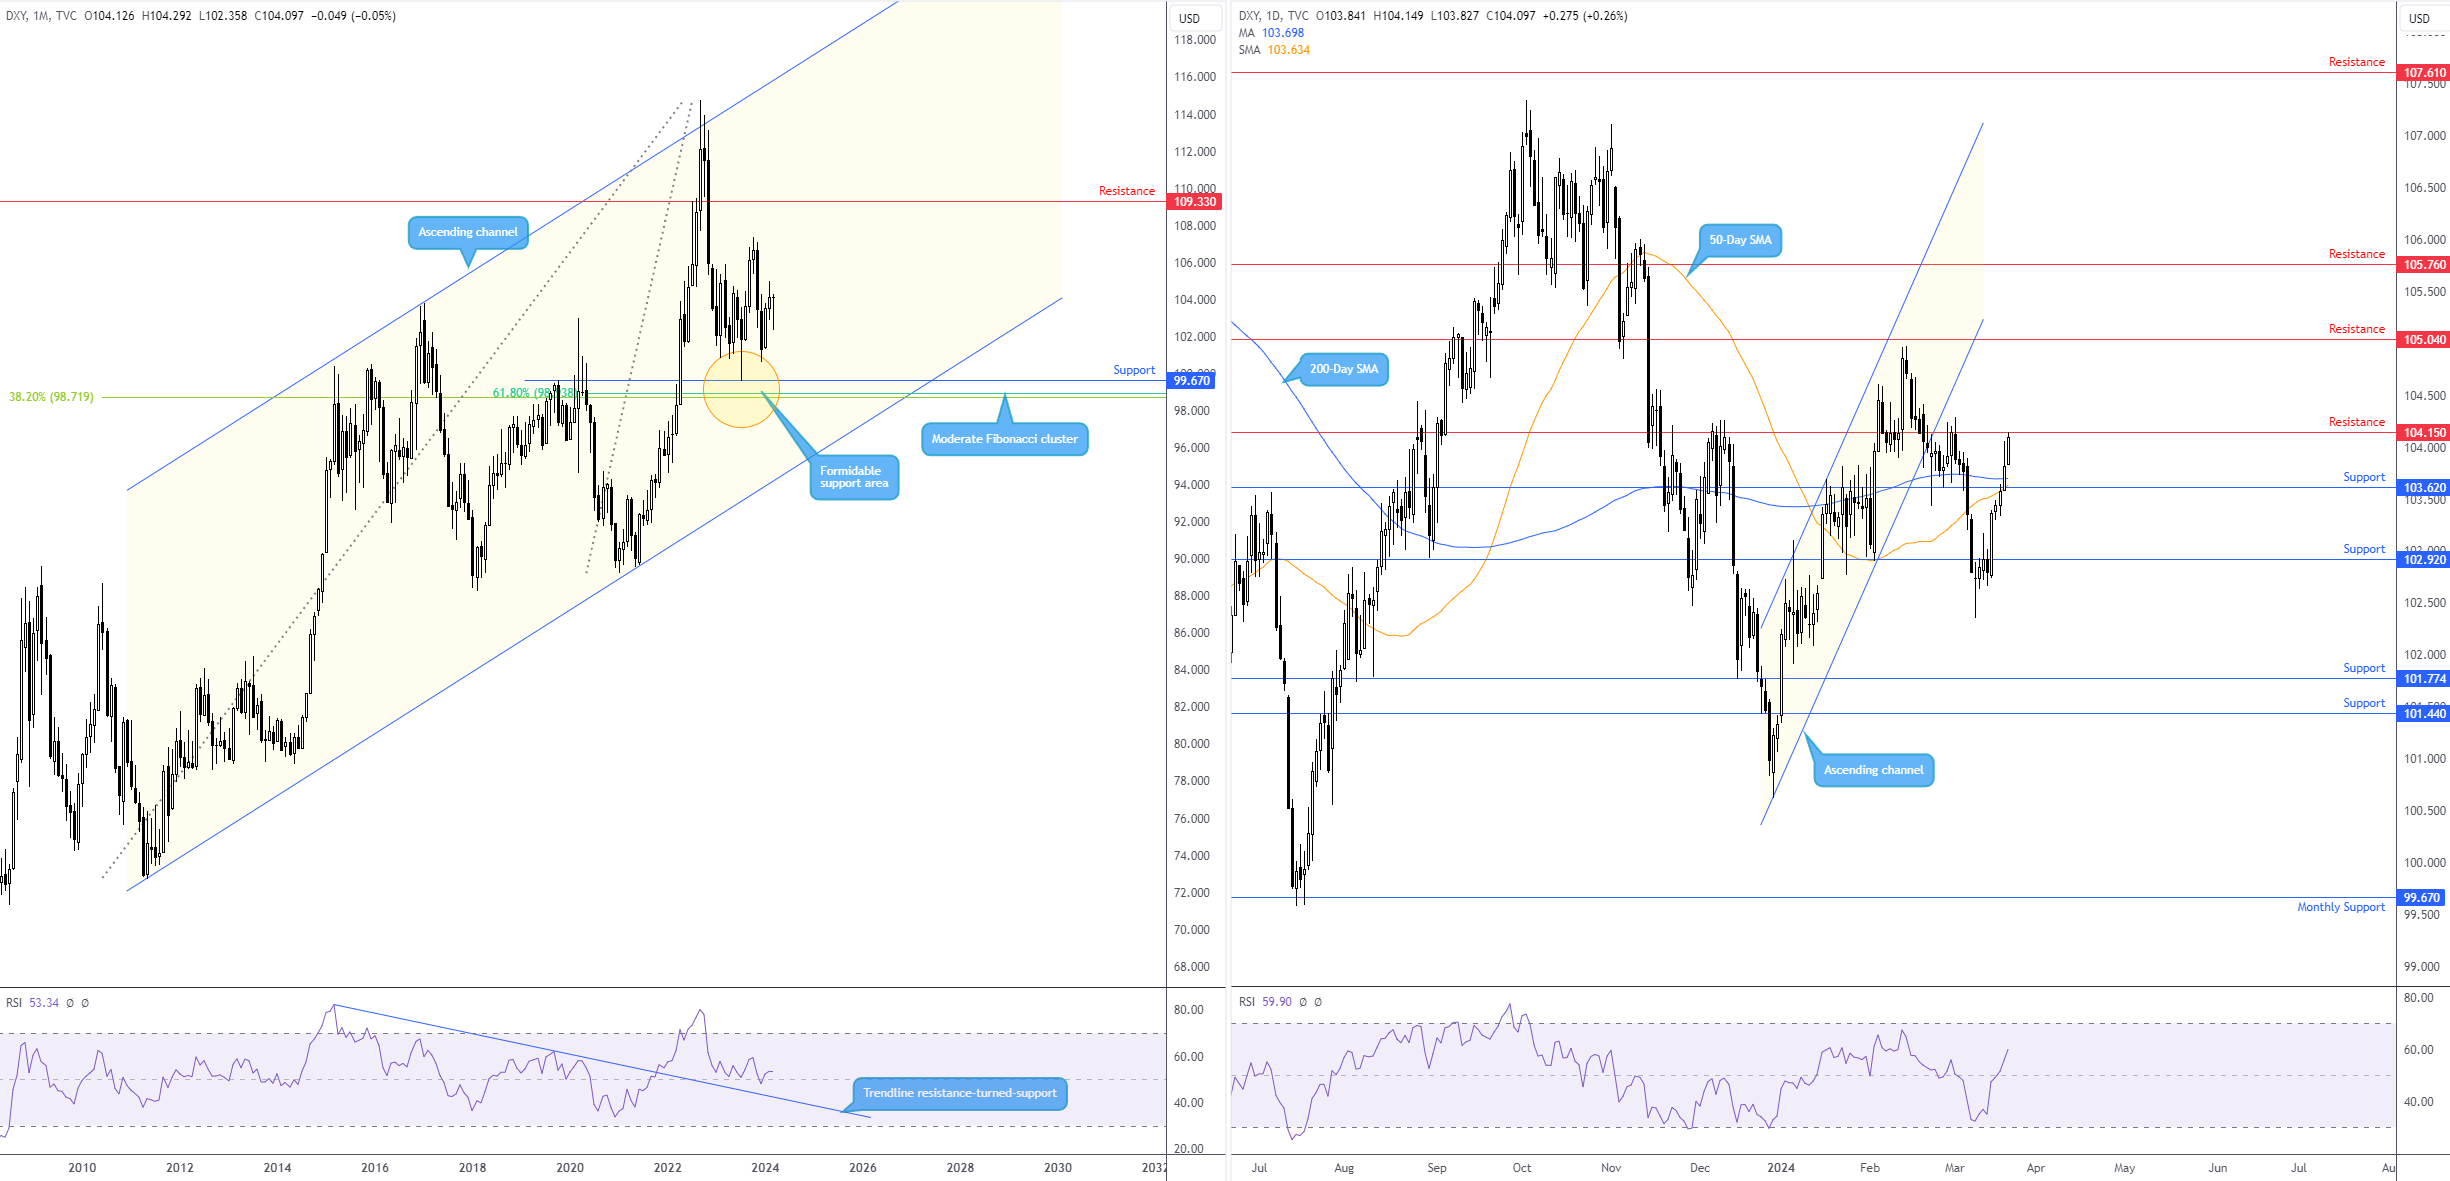
Ahead of today’s event, the US Dollar Index has buyers and sellers squaring off ahead of resistance on the daily timeframe at 104.15 after forging a spirited move through offers at resistance from 103.62 (now marked support) and the 200-day and 50-day simple moving averages (SMAs) at 103.70 and 103.63, respectively.
Ultimately, the technical side of things places a bold question mark on the current daily resistance at 104.15. Both the monthly and daily timeframes display positive momentum (> 50.00), in addition to the longer-term trend facing north on the monthly timeframe. Should today’s event trigger a hawkish repricing, demand for the USD will likely send the unit beyond daily resistance, which, in turn, may see breakout buyers take aim at another layer of resistance from 105.04 on the daily scale.
Author

Aaron Hill
FP Markets
After completing his Bachelor’s degree in English and Creative Writing in the UK, and subsequently spending a handful of years teaching English as a foreign language teacher around Asia, Aaron was introduced to financial trading,

















