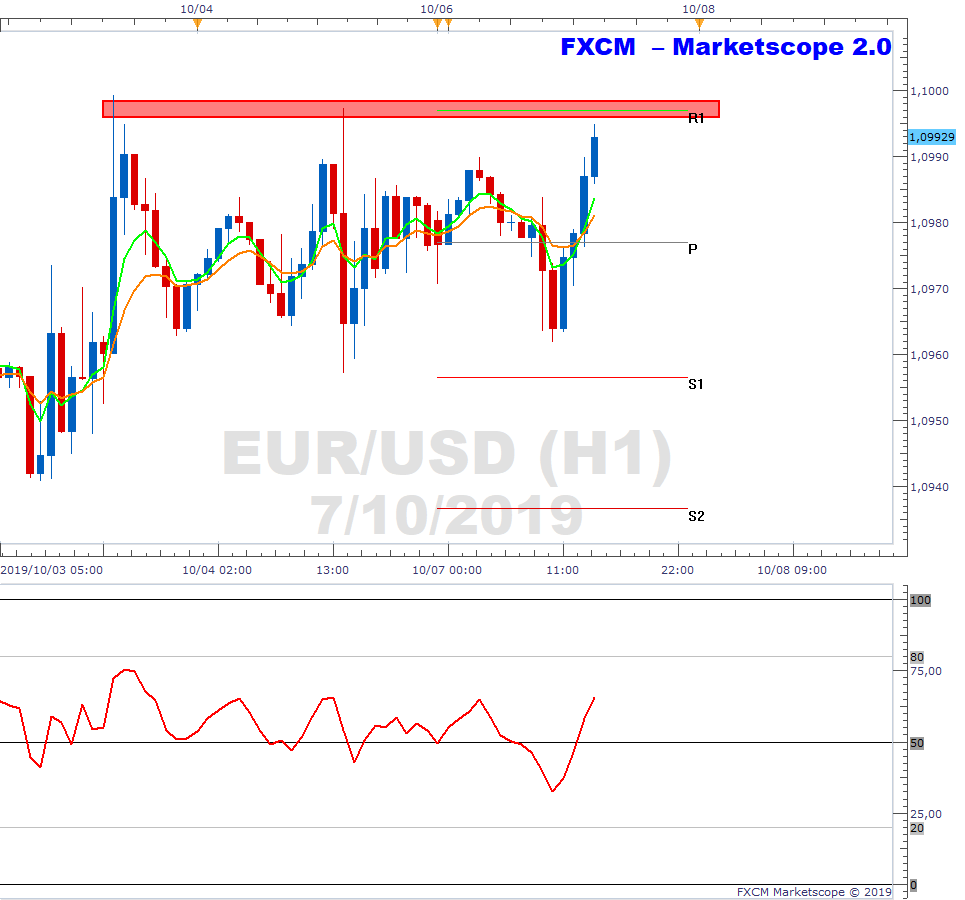
EUR/USD Is Trading Close to Resistance on H1 Chart


The below is the hourly chart of the EURUSD. Price is moving towards the R1 pivot. This level overlaps with price resistance (red shaded horizontal) and this confluence may act as a key level that leads to a price reaction. To confirm, the green 5-hour EMA will need to cross below the orange 10-hour EMA and the RSI will need to drop below the 50 level. These will be regarded as confirmation of the price reaction. Thereafter, the EMAs will need to show angle and separation as an indication of growing downwards momentum if the reaction is to be menaingful. We continue to monitor.
Past performance is not an indicator of future results.
CHART SOURCE: FXCM MARKETSCOPE 2.0
Author
Russell Shor (MSTA, CFTe, MFTA) has an Honours Degree in Economics from the University of South Africa and holds the coveted Certified Financial Technician and Master of Financial Technical Analysis qualifications from the Interna