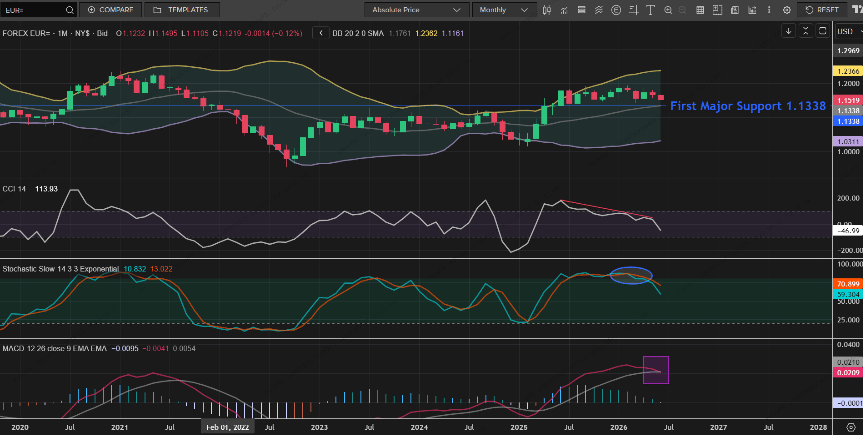
EUR/USD: Technical indicators align for a bearish shift

A bearish outlook for the EUR toward the 1.1300 level is well-supported by multiple indicators. There is a sweeping shift in momentum across different layers of technical analysis.
Bollinger Bands: A rejection at the top
On the price chart, we can see that the candles recently pushed against or slightly exceeded the Upper Bollinger Band, signaling an overextended move. Price action has since stalled and is now turning downward, moving away from that upper boundary. price fails to sustain a breakout above the upper band, it naturally seeks equilibrium. The next target for this pullback is the Middle Band (the 20-period Moving Average) around 1.1338.
CCI (Commodity Channel Index): Exiting overbought territory
In the second panel, the white CCI line shows a distinct downward slope, highlighted by the red trendline drawn over its recent peaks. After peaking in overbought territory, the line is now "heading south." This shift indicates that the asset's velocity is slowing down rapidly. The downward trajectory confirms that the buyers are losing their grip, and sellers are beginning to take control of the immediate trend.
Slow stochastic: The bearish crossover
The faster line (light blue) has clearly crossed below the slower signal line (orange) while high up in the overbought zone. Following this crossover, both lines are now pointing steeply downward. This is a classic textbook sell signal, indicating that the asset's closing prices are consistently ending near the lower end of their recent range, confirming a structural shift toward a downtrend.
MACD
Finally, in the bottom panel inside the purple square, the MACD indicator provides the ultimate confirmation.
The faster MACD line (red) has crossed below the slower signal line (grey). Simultaneously, the histogram bars underneath are shrinking and beginning to transition. This crossover at a relatively high point proves that the medium-term moving averages are diverging to the downside. It is a highly reliable lagging indicator that confirms the birth of a new bearish cycle.
Author

Hany Saleeb
Independent Analyst
Hany Saleeb is a highly experienced Senior Treasurer. With over a decade of experience in treasury, served as Head of Treasury at BM in France and head of research in Sinai Securities.


