EUR/USD price analysis: H4 bearish inertia persists below 1.1250 as institutional supply caps upside
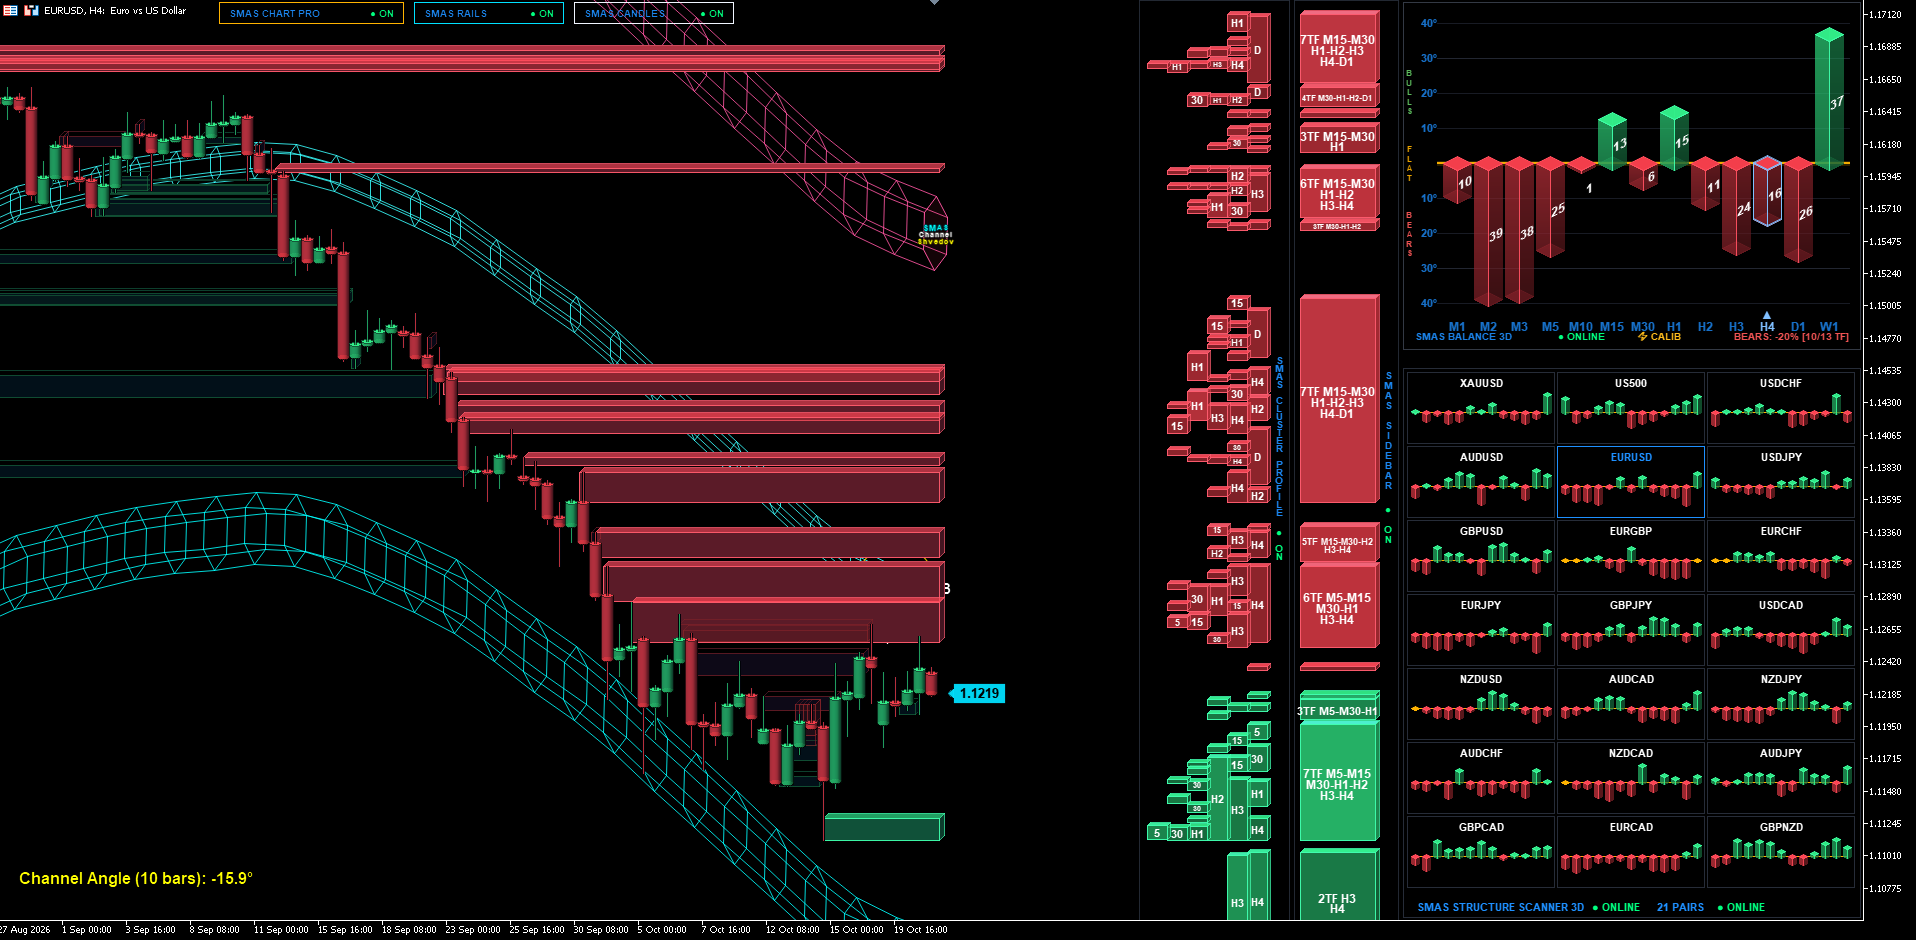
- EUR/USD consolidates near 1.1221 within a clearly defined descending Structure Engine corridor (-15.9°).
- The Structure Balance 3D telemetry confirms dominant institutional selling: BEARS -20% across 10 of 13 timeframes.
- Immediate overhead supply is anchored by stacked 6TF and 5TF resistance massifs, while downside liquidity aims toward the 7TF demand basin at 1.1140.

Technical overview: The -15.9° structural slope
On the 4-hour chart, EUR/USD remains entrenched in a persistent downward trajectory. The proprietary SMAS Structure Engine projects an invariant downward slope of -15.9°, keeping price action contained along the lower boundary of the 3D volatility conduit.
The current relief bounce from recent lows near 1.1150 has brought the pair to 1.1221. However, this upward retracement is encountering a multi-layered barrier of institutional supply, indicating that buying momentum represents temporary liquidity absorption rather than an authentic trend reversal.
Multi-timeframe telemetry (Structure balance 3D)
The real-time Structure Balance 3D matrix registers an aggregate reading of BEARS: -20%, with 10 of 13 monitored timeframes locked in negative territory:
- Micro-intraday horizon: Acute downward pressure continues on M2 (-39°), M3 (-38°), and M5 (-25°).
- Intermediate & swing frames: The primary directional bias is reinforced by negative readings across M30 (-6°), H2 (-11°), H3 (-24°), and the benchmark H4 frame (-16°).
- Relief drivers: Mild counter-trend momentum is observed strictly on M15 (+13°) and H1 (+15°), reflecting the short-term pullback into local resistance.
- Macro horizon: While the weekly baseline remains positive (W1 +37°), the daily frame (D1 -26°) continues to exert heavy gravitational pull downward.
Order-book massifs and liquidity clusters (Sidebar 3D)
The SMAS Sidebar 3D and Cluster Profile reveal severe structural asymmetry:
- Overhead Resistance: Price is advancing directly into a multi-tiered ceiling. Immediate resistance is established by an intermediate 6TF cluster (M5-M15-M30-H1-H3-H4) spanning 1.1280–1.1310, backed by a higher 7TF super-cluster at 1.1400–1.1460. The Cluster Profile decodes high limit-order density across this entire band.
- Underlying Support: The nearest major structural cushion lies at the 7TF demand super-massif (M5-M15-M30-H1-H2-H3-H4) in the 1.1100–1.1150 range, where deep institutional buying previously halted the selloff.
Execution setup and tactical outlook
With the -15.9° structural slope intact and 10 of 13 timeframes aligned on the sell side, trading protocol prioritizes short positions on corrective rallies into supply:
- Short entry zone: 1.1245 – 1.1270 (testing the lower edge of the 6TF supply massif).
- Protective stop loss: 1.1325 (placed strictly above the 6TF structural barrier, risking ~55 pips).
- Take profit 1: 1.1160 (initial profit lock, test of local support; adjust stop to breakeven).
- Take profit 2: 1.1115 (full rotation into the 7TF institutional demand basin, +130–150 pips).
- Bullish invalidation: A sustained 4-hour close above 1.1330 would neutralize the immediate bearish vector and trigger a broader recovery toward 1.1420.
Author

Andrey Shvedov
SMAS Quantum Research
Andrey Shvedov is an active quantitative trader, software architect, and financial market researcher with over 24 years of live market microstructure experience.