EUR/USD path of least resistance is down on Non-Farm Payrolls day — Confluence Detector


The EUR/USD is trading in a tense range as a turbulent week draws to a close and the US Non-Farm Payrolls report is eyed. The pair might find it easier to fall.

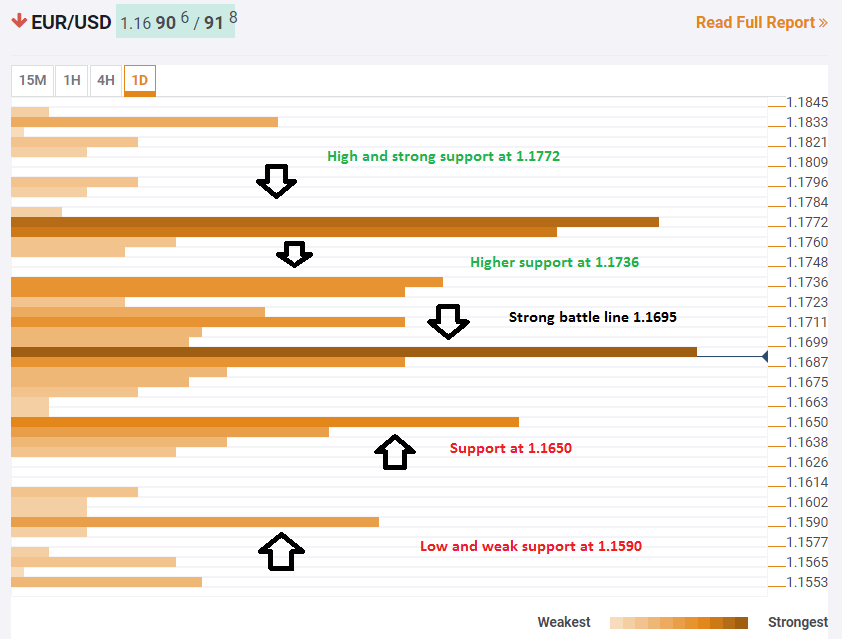
The Technical Confluences Indicator shows that the pair faces an immediate dense cluster of resistance at 1.1695. The long list of technical lines includes the Simple Moving Average 5-15m, the SMA 100-15m, the SMA 50-15m, the SMA 10-1h, the SMA 5-4h, the Fibonacci 23.6% one-week and the Fibonacci 38.2% one-day.

Should the pair move higher, the next convergence of resistance lines is close. The 1.1736 is the confluence of the Fibonacci 38.2% one-month, the Pivot Point one-day Resistance 1, and the one-day high. An even stronger line awaits at 1.1772 which is the congestion of the Simple Moving Average 100-4h, the Pivot Point one-day Resistance 2, the Pivot Point one-way Resistance 1, and the Fibonacci 61.8% one-week. 

On the downside, the pair may find support at 1.1650 which is the confluence of the Fibonacci 23.6% one-month, the Pivot Point one-day Support 1, the Simple Moving Average 100-1h, the SMA 5-1d. A weaker cluster of support awaits at 1.1590 which is the Pivot Point one-week Support 1 and the Fibonacci 161.8% one-day.

Here is how it looks on the tool:

EUR USD June 2018 technical analysis confluence levels

Confluence Detector

The Confluence Detector finds exciting opportunities using Technical Confluences. The TC is a tool to locate and point out those price levels where there is a congestion of indicators, moving averages, Fibonacci levels, Pivot Points, etc. Knowing where these congestion points are located is very useful for the trader, and can be used as a basis for different strategies.

This tool assigns a certain amount of “weight” to each indicator, and this “weight” can influence adjacents price levels. These weightings mean that one price level without any indicator or moving average but under the influence of two “strongly weighted” levels accumulate more resistance than their neighbors. In these cases, the tool signals resistance in apparently empty areas.

Learn more about Technical Confluence

Information on these pages contains forward-looking statements that involve risks and uncertainties. Markets and instruments profiled on this page are for informational purposes only and should not in any way come across as a recommendation to buy or sell in these assets. You should do your own thorough research before making any investment decisions. FXStreet does not in any way guarantee that this information is free from mistakes, errors, or material misstatements. It also does not guarantee that this information is of a timely nature. Investing in Open Markets involves a great deal of risk, including the loss of all or a portion of your investment, as well as emotional distress. All risks, losses and costs associated with investing, including total loss of principal, are your responsibility. The views and opinions expressed in this article are those of the authors and do not necessarily reflect the official policy or position of FXStreet nor its advertisers. The author will not be held responsible for information that is found at the end of links posted on this page.

If not otherwise explicitly mentioned in the body of the article, at the time of writing, the author has no position in any stock mentioned in this article and no business relationship with any company mentioned. The author has not received compensation for writing this article, other than from FXStreet.

FXStreet and the author do not provide personalized recommendations. The author makes no representations as to the accuracy, completeness, or suitability of this information. FXStreet and the author will not be liable for any errors, omissions or any losses, injuries or damages arising from this information and its display or use. Errors and omissions excepted.

The author and FXStreet are not registered investment advisors and nothing in this article is intended to be investment advice.

Recommended Content


Recommended Content

Editors’ Picks

EUR/USD declines below 1.0700 as USD recovery continues

EUR/USD declines below 1.0700 as USD recovery continues

EUR/USD lost its traction and declined below 1.0700 after spending the first half of the day in a tight channel. The US Dollar extends its recovery following the strong Unit Labor Costs data and weighs on the pair ahead of Friday's jobs report.

EUR/USD News

GBP/USD struggles to hold above 1.2500

GBP/USD struggles to hold above 1.2500

GBP/USD turned south and dropped below 1.2500 in the American session on Thursday. The US Dollar continues to push higher following the Fed-inspired decline on Wednesday and doesn't allow the pair to regain its traction.

GBP/USD News

Gold slumps below $2,300 as US yields rebound

Gold slumps below $2,300 as US yields rebound

Gold extended its daily slide and dropped below $2,290 in the second half of the day on Thursday. The benchmark 10-year US Treasury bond yield erased its daily losses after US data, causing XAU/USD to stretch lower ahead of Friday's US jobs data.

Gold News

Top 3 Price Prediction BTC, ETH, XRP: Altcoins to pump once BTC bottoms out, slow grind up for now

Top 3 Price Prediction BTC, ETH, XRP: Altcoins to pump once BTC bottoms out, slow grind up for now

Bitcoin reclaiming above $59,200 would hint that BTC has already bottomed out, setting the tone for a run north. Ethereum holding above $2,900 keeps a bullish reversal pattern viable despite falling momentum. Ripple coils up for a move north as XRP bulls defend $0.5000.

Read more

Happy Apple day

Happy Apple day

Apple is due to report Q1 results today after the bell. Expectations are soft given that Apple’s Chinese business got a major hit in Q1 as competitors increased their market share against the giant Apple. 

Read more

Majors

Cryptocurrencies

Signatures