EUR/USD Forecast: Sellers keeping advances in check

EUR/USD Current Price: 1.0698
- European Central Bank officials repeated a 50 bps rate hike is coming in March.
- Upcoming US data could imprint life to quiet financial markets.
- EUR/USD is at risk of extending its decline but still needs to pierce 1.0655.
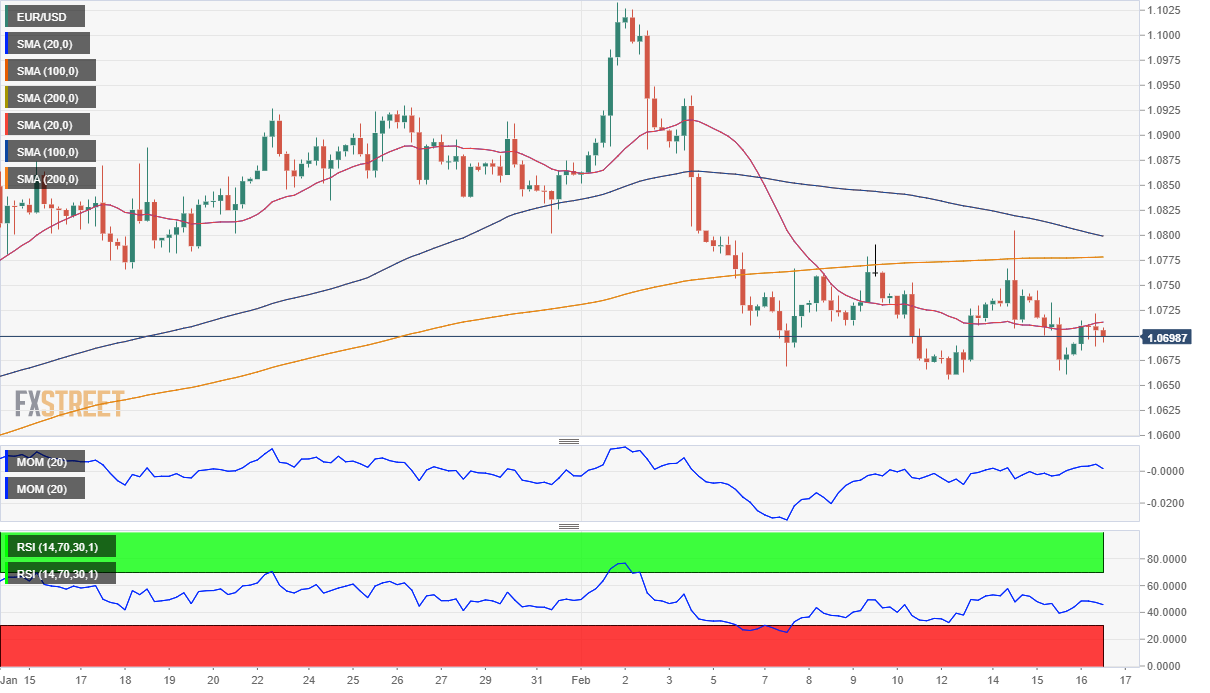
Financial markets are quieter on Thursday, with EUR/USD consolidating at around 1.0700. Following some United States first-tier figures and renewed demand for the Greenback, the American currency lost steam. The better performance of stock markets and easing government bond yields are partially responsible for the near-term US Dollar weakness.
However, the Euro is incapable of attracting speculative interest. On the one hand, Euro Zone macroeconomic figures released these days came in worse than anticipated, hinting at an economic slowdown. On the other, European Central Bank (ECB) officials who were on the wires fell short of providing fresh clues. ECB President Christine Lagarde repeated on Wednesday that a 50 basis points (bps) rate hike will come in March, while further rate hikes would be decided meeting by meeting.
On Thursday, the ECB released the Economic Bulletin, with updates on the economic, financial and monetary developments in the Euro Area. The document showed that the Governing Council saw weakening global economic activity at the turn of the year, following robust growth in the third quarter of 2022. It also noted that “future policy rate decisions will continue to be data-dependent and follow a meeting-by-meeting approach.”
Data-wise, the US will release January Building Permits and Housing Starts, Initial Jobless Claims for the week ended February 10, and the January Producer Price Index (PPI).
EUR/USD short-term technical outlook
The EUR/USD pair trades at the lower end of its intraday range, currently struggling to retain the 1.0700 level. Technical readings in the daily chart offer a neutral-to-bearish stance, as the pair keeps meeting sellers ahead of 1.0745, the 61.8% retracement of the 2022 yearly slump. Furthermore, the 20 Simple Moving Average (SMA) gains downward traction above the current level, while technical indicators hold directionless within negative levels. On a positive note, the 100 SMA advances above a flat 200 SMA, but it stands in the 1.0390 region, too far to be relevant in the near term.
The pair is bearish, according to the 4-hour chart. A flat 20 SMA caps advances while the longer ones remain above it. At the same time, technical indicators head south within negative levels, although with a little downward momentum. The pair still needs to break through the weekly low at 1.0655 to gain bearish strength, eyeing then a test of the 50% retracement of the slump mentioned above at 1.0515.
Support levels: 1.0655 1.0620 1.0570
Resistance levels: 1.0745 1.0790 1.0830
Author

Valeria Bednarik
FXStreet
Valeria Bednarik was born and lives in Buenos Aires, Argentina. Her passion for math and numbers pushed her into studying economics in her younger years.

















