EUR/USD Forecast: Is EUR heading back to Jan 2017 lows?
- The EUR/USD has dropped closed for 1000 pips in four months.
- Monthly chart signals bear revival in the EUR/USD pair.

Currently, the EUR/USD pair is trading at 1.1560, having clocked a high of 1.2556 in February. The 1000-pip sell-off in the common currency seems to have put the bears back into the driver's seat, the monthly chart indicates.
Monthly chart
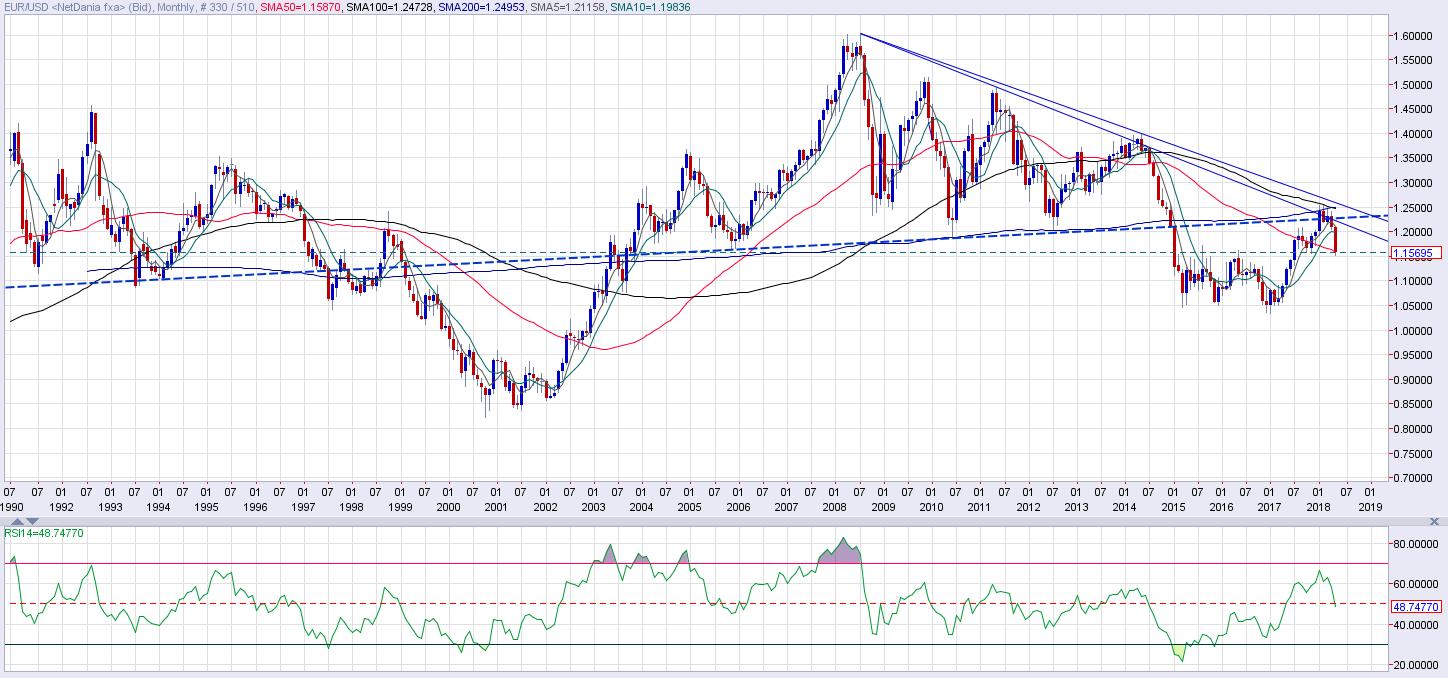
Chart Source: Netstation
The decline from 1.2556 to 1.1560 represents bull failure:
- Inability to cut through the falling trendline (drawn from July 2008 high and May 2011 high) in a convincing manner.
- Rejection at the 200-month MA and 1.2517 - 38.2% Fib R of Jan 2008 high - Jan 2017 low).
- Inability to capitalize on the move above the long-term head-and-shoulders neckline.
The chart also shows the 5-month moving average (MA) and the 10-month moving average (MA) has rolled over in favor of the bears and the 100-month MA has crossed the 200-month MA in the EUR-negative manner.
Further, acceptance below the descending (bearish) 50-month MA would only embolden the bears and shall put the focus back on the death cross (50-month and 200-month MA bear cross seen in November 2016).
The relative strength index (RSI) has also regained bearish bias (back below 50.00). So, it appears the pair could revisit lows below 1.05 in the next 12 months or so.
At press time, the 14-day relative strength index (RSI) shows the pair is most oversold in over three years. So, a short-term corrective rally could be in the offing. However, only a convincing move above 1.20 would abort the bearish view put forward by the monthly chart.
Author

Omkar Godbole
FXStreet Contributor
Omkar Godbole, editor and analyst, joined FXStreet after four years as a research analyst at several Indian brokerage companies.


