EUR/USD Forecast: Demand for safety means a retest of the year low at 1.1120

EUR/USD Current Price: 1.1307
- Russian President Putin recognized Donetsk and Luhansk as independent states.
- US markets were closed due to a local holiday, stocks futures are sharply down.
- EUR/USD gains bearish strength but needs to break the 1.1300 support level.
The EUR/USD pair treads water just above the 1.1300 level, down on Monday. The pair started the day with strength, approaching the 1.1400 threshold before turning south during London trading hours amid continued weakness among global stocks. The sour mood is directly linked to mounting tensions in Eastern Europe, as Western nations suspected an imminent invasion of the Ukrainian Donbass territory by Russia. Over the weekend, fire exchange and some shelling were reported in the region. Finally, mid-US-afternoon news agencies reported that Russian President Vladimir Putin recognized Donetsk and Luhansk in Eastern Ukraine as independent states, boosting demand for safety.
Asian and European indexes closed in the red, while US futures edged lower, hinting at persistent risk-aversion in the upcoming sessions.
Markit published the preliminary estimates of its February PMIs for the EU. The services sector posted a nice comeback with the German index up to 56.6 and that of the EU printing at 55.8. The manufacturing PMI in both economies came in below expected but well above the 50 level that divides contraction from economic expansion. Germany unveiled the January Producer Price Index, which was up 2.2% MoM and 25% YoY, surpassing the market’s expectations. US markets were closed in observance of Presidents Day.
The macroeconomic calendar will include on Tuesday the German February IFO Business Climate survey and the US February Markit flash PMIs and Consumer Confidence for the same month.
EUR/USD short-term technical outlook
The EUR/USD pair is trading around the 1.1310 level, offering a neutral-to-bearish technical stance. The daily chart shows that the pair met sellers near a firmly bearish 100 SMA, which currently stands at around 1.1400. The pair is currently hovering around a directionless 20 SMA, while the RSI indicator also lacks directional strength and hovers around 48. Finally, the Momentum indicator retreated from near overbought readings, and currently nears its midline, all of which indicates decreasing buying interest.
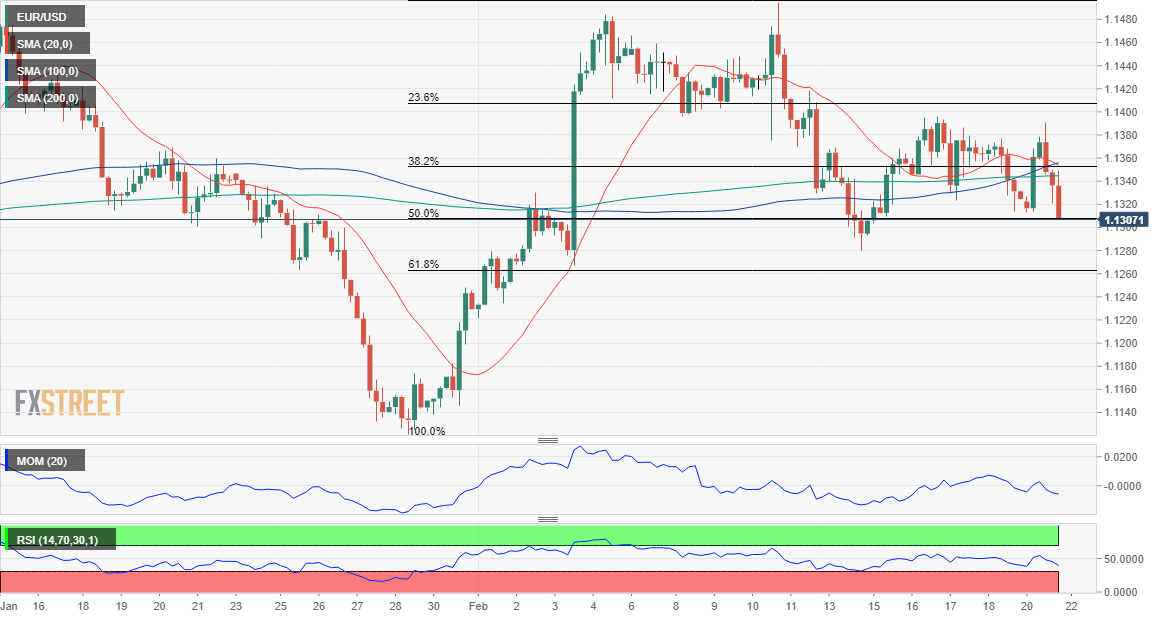
The 4-hour chart shows that the pair is now below a congestion of moving averages, which lack directional strength as technical indicators gain bearish traction within negative levels, skewing the risk to the downside without confirming it. A break through the 1.1300 figure should open the door for a steeper decline, moreover, if the downbeat mood persists.
Support levels: 1.1305 1.1260 1.1220
Resistance levels: 1.1360 1.1405 1.1460
Author

Valeria Bednarik
FXStreet
Valeria Bednarik was born and lives in Buenos Aires, Argentina. Her passion for math and numbers pushed her into studying economics in her younger years.


![How Wall Street rigs the game [Video]](https://editorial.fxsstatic.com/images/i/market-chaos-01.jpg)














