EUR/USD Forecast: Bulls not willing to give up, aiming for 1.1000 and beyond

EUR/USD Current Price: 1.0962
- Another batch of dismal United States data keeps the Greenback under pressure.
- Stock markets stay on the back foot, while government bond yields ease.
- EUR/USD maintains the bullish momentum and aims to cross the 1.1000 threshold.
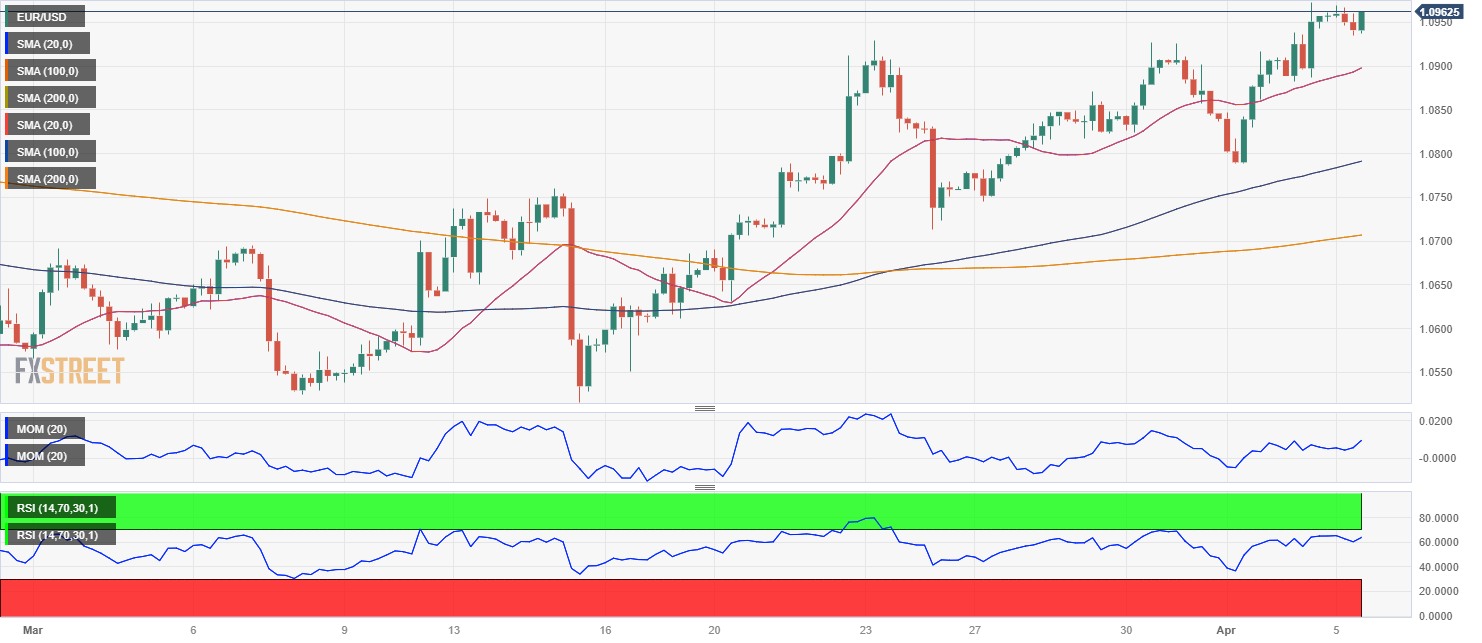
The EUR/USD pair retains most of its weekly gains, trading around the 1.0960 level after hitting 1.0972 on Tuesday, its highest since mid-February. Another batch of poor United States macroeconomic data maintains the US Dollar on the losing side. Ahead of Wall Street’s opening, the ADP survey showed that the private sector added 145,000 new job positions in March, missing the market expectation of 200,000.
At the same time, MBA Mortgage Applications for the week ended March 31 declined by a whopping 4.1%, much worse than the previous 2.9% advance. Finally, the February Goods and Services Trade Balance posted a deficit of $ 70.5 billion, worse than anticipated.
Earlier in the day, S&P Global published the final estimate of the Eurozone March Services PMIs. German figure was downwardly revised to 53.7, while the EU figure came down to 55 from a previous estimate of 55.6. Despite discouraging, the indexes remain within expansion territory, having a limited impact on the Euro.
Later in the American session, the US will publish the official ISM Services PMI, foreseen at 54.5 in March, while S&P Global will release its own estimate.
Meanwhile, stock markets struggle to trim losses. Most Asian indexes closed in the red, while European ones are mixed around their opening levels, weighing on US futures. On the other hand, government bond yields continue to retreat from their early-month highs, with the 10-year Treasury note currently offering 3.31%.
EUR/USD short-term technical outlook
The daily chart for the EUR/USD pair shows that bulls are willing to move higher. The pair keeps developing above firmly bullish 20 and 100 Simple Moving Averages (SMA), with the shorter one currently at 1.0775. Technical indicators have partially lost their bullish momentum, consolidating near overbought readings.
The 4-hour chart reflects the solid bullish potential, as the Momentum indicator maintains its bullish slope well into positive levels, while the Relative Strength Index (RSI) indicator consolidates around 64. At the same time, the pair is consolidating far above bullish moving averages, with the 20 SMA providing near-term support at 1.0895.
Support levels: 1.0930 1.0895 1.0840
Resistance levels: 1.0985 1.1020 1.1065
Author

Valeria Bednarik
FXStreet
Valeria Bednarik was born and lives in Buenos Aires, Argentina. Her passion for math and numbers pushed her into studying economics in her younger years.