EUR/USD Forecast: Break through 1.1000 and fresh YTD highs confirm mid-term trend

EUR/USD Current Price: 1.1043
- United States macroeconomic data keeps confirming Fed’s dovish stance.
- German inflation was confirmed at 7.8% YoY in March, as previously estimated.
- EUR/USD bullish momentum remains robust, immediate resistance at 1.1060.
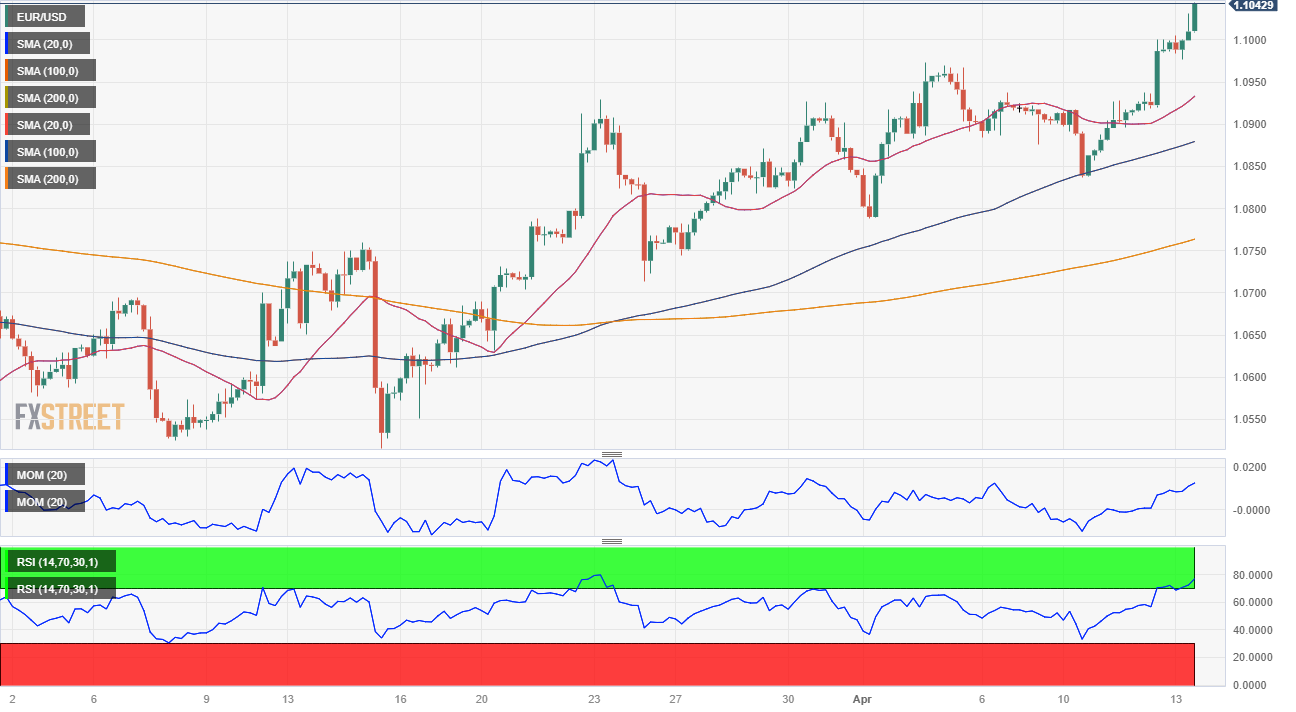
The EUR/USD pair recaptured the 1.1000 level and trades at its highest in a year in the 1.1040 price zone. The US Dollar extended the inflation-inspired sell-off and remained on the back foot throughout the first half of the day, as the United States Consumer Price Index (CPI) rose a modest 0.1% MoM in March, and at an annualized pace of 5%, below the market’s expectations.
The news confirmed the recent dovish stance adopted by the Federal Reserve (Fed). The Federal Open Market Committee (FOMC) Minutes released on Wednesday showed that Fed officials analyzed a pause in the tightening cycle amid the banking crisis that unfolded in the US in mid-March.
The collapse of two banks in March—and the turmoil that ensued—prompted several Federal Reserve officials to contemplate a pause in the central bank’s tightening cycle and led Fed staff to forecast a mild recession starting later this year. Policymakers “generally observed that the recent developments in the banking sector had further increased the already-high level of uncertainty associated with their outlooks for economic activity, the labor market, and inflation,” the minutes read.
The Euro, on the other hand, found support in European data. Germany confirmed the Harmonized Index of Consumer Prices (HICP) at 7.8% YoY in March, as per previous estimates. Also, Eurozone Industrial Production rose 1.5% MoM in February and by 2% YoY, beating the market’s expectations.
Ahead of Wall Street’s opening, the US published Initial Jobless Claims for the week ended April 7, which rose by 239K, worse than the 232K expected. Additionally, the March Producer Price Index (PPI) contracted by 0.5% MoM, better than anticipated, and rose by 2.7% on a yearly basis, decreasing from the previous 4.6%. The news are good news for the Federal Reserve but bad for the Greenback.
EUR/USD short-term technical outlook
The EUR/USD pair trades near its recent high of 1.1052, and the daily chart shows that the positive momentum is set to continue. Technical indicators head firmly north within positive levels, with the Momentum indicator still below its yearly high and the Relative Strength Index (RSI) indicator nearing overbought readings. At the same time, the pair extends its advance above bullish moving averages, with the nearest one being the 20 Simple Moving Average (SMA) at 1.0860.
The pair is overbought in the near term but without signs of upward exhaustion. In the 4-hour chart, technical indicators maintain upward slopes within overbought levels while the pair further advanced beyond bullish moving averages. The pair has some relevant weekly highs from 2022 in the 1.1050 area, which means further gains are to be expected once above it.
Support levels: 1.0980 1.0930 1.0890
Resistance levels: 1.1060 1.1100 1.1145
Author

Valeria Bednarik
FXStreet
Valeria Bednarik was born and lives in Buenos Aires, Argentina. Her passion for math and numbers pushed her into studying economics in her younger years.