EUR/USD Forecast: Bears maintain control ahead of FOMC Minutes

EUR/USD Current Price: 1.0640
- The Federal Open Market Committee will release the Minutes of its latest meeting.
- Germany confirmed the January Harmonized Index of Consumer Prices at 9.2% YoY.
- EUR/USD is at risk of falling further as sellers continue to pressure the monthly low.
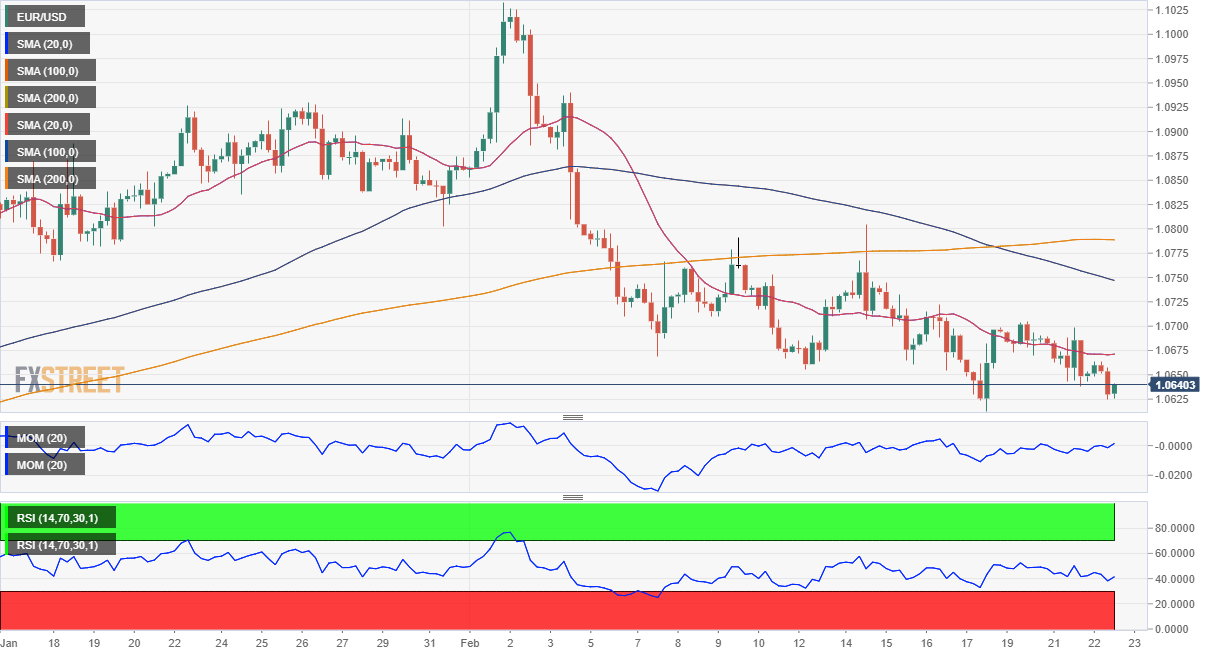
The EUR/USD pair trades near its February monthly low at 1.0612, as risk aversion keeps benefiting the US Dollar. Following Wall Street’s sharp decline on Tuesday, Asian and European equities edged lower, maintaining the red ahead of the US opening. Geopolitical tensions continue to undermine the market mood as China escalated the bet, with a top local diplomat claiming they would deepen strategic cooperation with Russia. Also, signs that US inflation will take longer to reach the Federal Reserve’s 2% target weight on sentiment, as it means monetary tightening will continue longer than previously estimated.
Data-wise, Germany confirmed the January Harmonized Index of Consumer Prices (HICP) at 9.2% YoY. The country’s February IFO survey on Business Climate, however, missed the market expectations as the index printed at 91.1 vs the 91.4 expected. January reading, in the meantime, was downwardly revised to 90.1. The American session will bring the FOMC Meeting Minutes. The document will likely reaffirm the central bank’s hawkish stance and further dent the market mood.
EUR/USD short-term technical outlook
The daily chart for the EUR/USD pair favors another leg south. The pair is developing below a bearish 20 Simple Moving Average (SMA), which keeps approaching a static resistance level at 1.0745, the 61.8% retracement of the 2022 yearly decline, further reinforcing its relevance. At the same time, technical indicators remain within negative levels, reflecting sellers’ strength although falling short of hinting at a steeper decline amid their lack of directional strength. Finally, a bullish 100 SMA currently stands at 1.0425, too far from being relevant at the time being.
The 4-hour chart shows that the upside is limited by a mildly bearish 20 SMA, which stands far below the longer ones. The 100 SMA extended its bearish slope and currently stands a few pips above the aforementioned Fibonacci level, making it even more relevant. Meanwhile, the Momentum indicator heads lower within negative levels while the Relative Strength Index (RSI) indicator consolidates at around 40, all of which maintain the risk skewed to the downside.
Support levels: 1.0610 1.0570 1.0525
Resistance levels: 1.0700 1.0745 1.0790
Author

Valeria Bednarik
FXStreet
Valeria Bednarik was born and lives in Buenos Aires, Argentina. Her passion for math and numbers pushed her into studying economics in her younger years.

















