EUR/USD faces uphill task, Oil price rallies further
Key highlights
- EUR/USD started a fresh decline and traded below 1.0700.
- A key bearish trend line is forming with resistance near 1.0730 on the 4-hour chart.
EUR/USD technical analysis
Looking at the 4-hour chart, the pair settled below the 1.0700 support, the 100 simple moving average (red, 4 hours), and the 200 simple moving average (green, 4 hours).
It traded to a new multi-week low at 1.0631 and is currently consolidating losses. It is trading near the 23.6% Fib retracement level of the downward move from the 1.0769 swing high to the 1.0631 low.
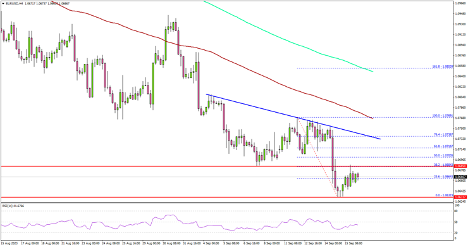
On the upside, the pair might face resistance near 1.0685. The next major resistance is near the 1.0720 zone. There is also a key bearish trend line forming with resistance near 1.0730 on the same chart. The trend line is near the 76.4% Fib retracement level of the downward move from the 1.0769 swing high to the 1.0631 low.
A close above 1.0735 could start another decent increase. In the stated case, the pair could rise toward the 1.0765 level. Any more gains might send EUR/USD toward the 1.0800 resistance.
On the downside, immediate support is near 1.0640. The next key support is seen near the 1.0620 level. If there is a move below 1.0620, the pair could dive toward 1.0550. Any more losses might send the pair toward the 1.0500 level.
Author

Aayush Jindal
TitanFX
I have spent over six years as a financial markets contributor and observer, and possess strong technical analytical skills. I am a software engineer by profession, loves blogging and observing financial markets.


