EUR/USD continental collision — 12-timeframe bearish cascade slams into 1.1190 weekly demand floor

Executive summary
The Euro (EUR/USD) has arrived at a pivotal multi-scale inflection coordinate. Following a relentless high-velocity selloff that drove price from the 1.1600 territory down to the current coordinate of 1.1192, the market is displaying the textbook signature of Terminal Kinetic Exhaustion.
While intraday and swing horizons remain engulfed in aggressive selling pressure — with 12 out of 13 timeframes locked in deep red territory (-26% to -27% aggregate bearish pressure) — the market has officially made direct physical contact with the immovable Weekly secular demand foundation at 1.1190.
Our multi-dimensional telemetry confirms that this downward impulse has completed its structural trajectory. The collision between a steep -21.9° H4 descent and nature’s scale-invariant Weekly trend (+15.6°) sets up a classic Coiled Spring Pattern, signaling that institutional volume absorption is actively underway and preparing an explosive mean-reversion rebound.
Multi-timeframe structural audit: The battle of scales
A. Weekly horizon (W1): The immovable secular bullish anchor (+15.6°)
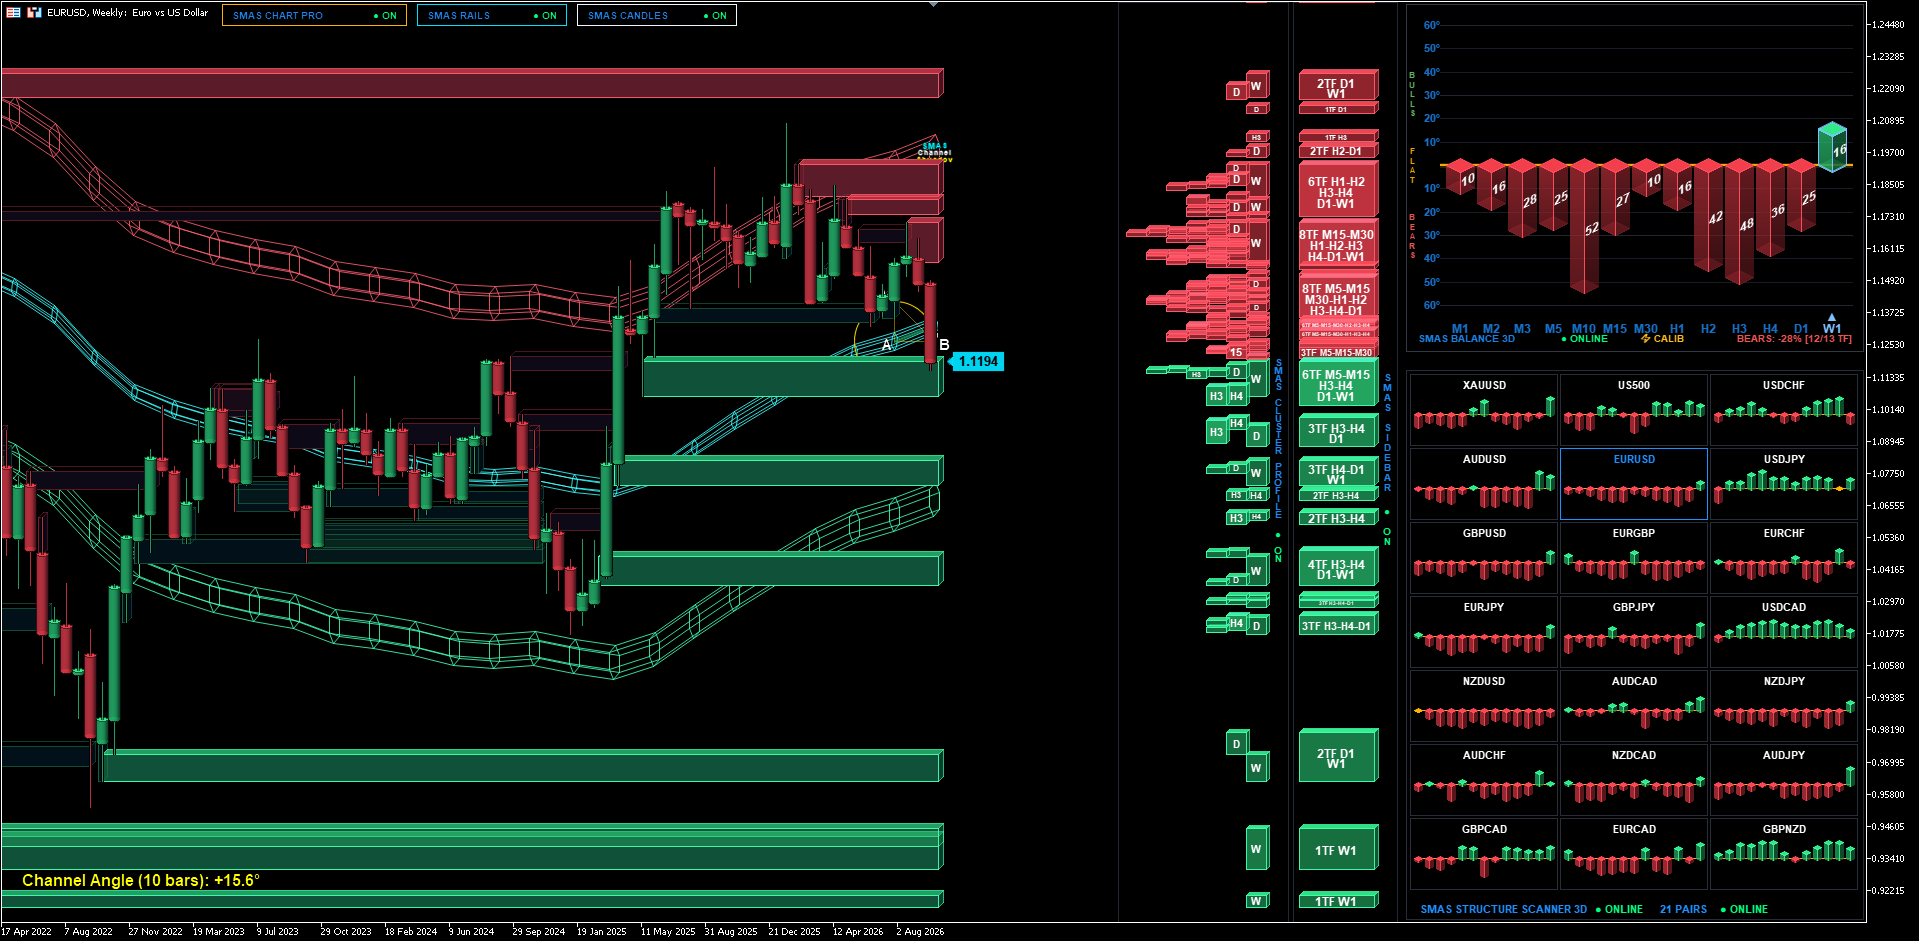
Examining the macro architectural canvas on the Weekly timeframe completely reframes the recent selloff.
- The primary Ordinary Least Squares (OLS) regression spine of the Weekly highway maintains an unambiguous upward gradient of +15.6°, proving that the multi-year secular trend remains firmly bullish.
- The current test of 1.1194 does not represent a structural breakdown; it represents a deep, macro-scale pullback directly into the hardened Weekly Institutional Demand Floor (6TF M5-M15-H3-H4-D1-W1).
- In physical mechanics, an object cannot penetrate a mass denser than itself without extraordinary external acceleration. The cluster massifs arrayed beneath 1.1190 represent multi-month sovereign capital accumulation that retail sellers cannot easily violate.
B. Daily (D1) and H4 cascade: Linear exhaustion into the 2-sigma boundary
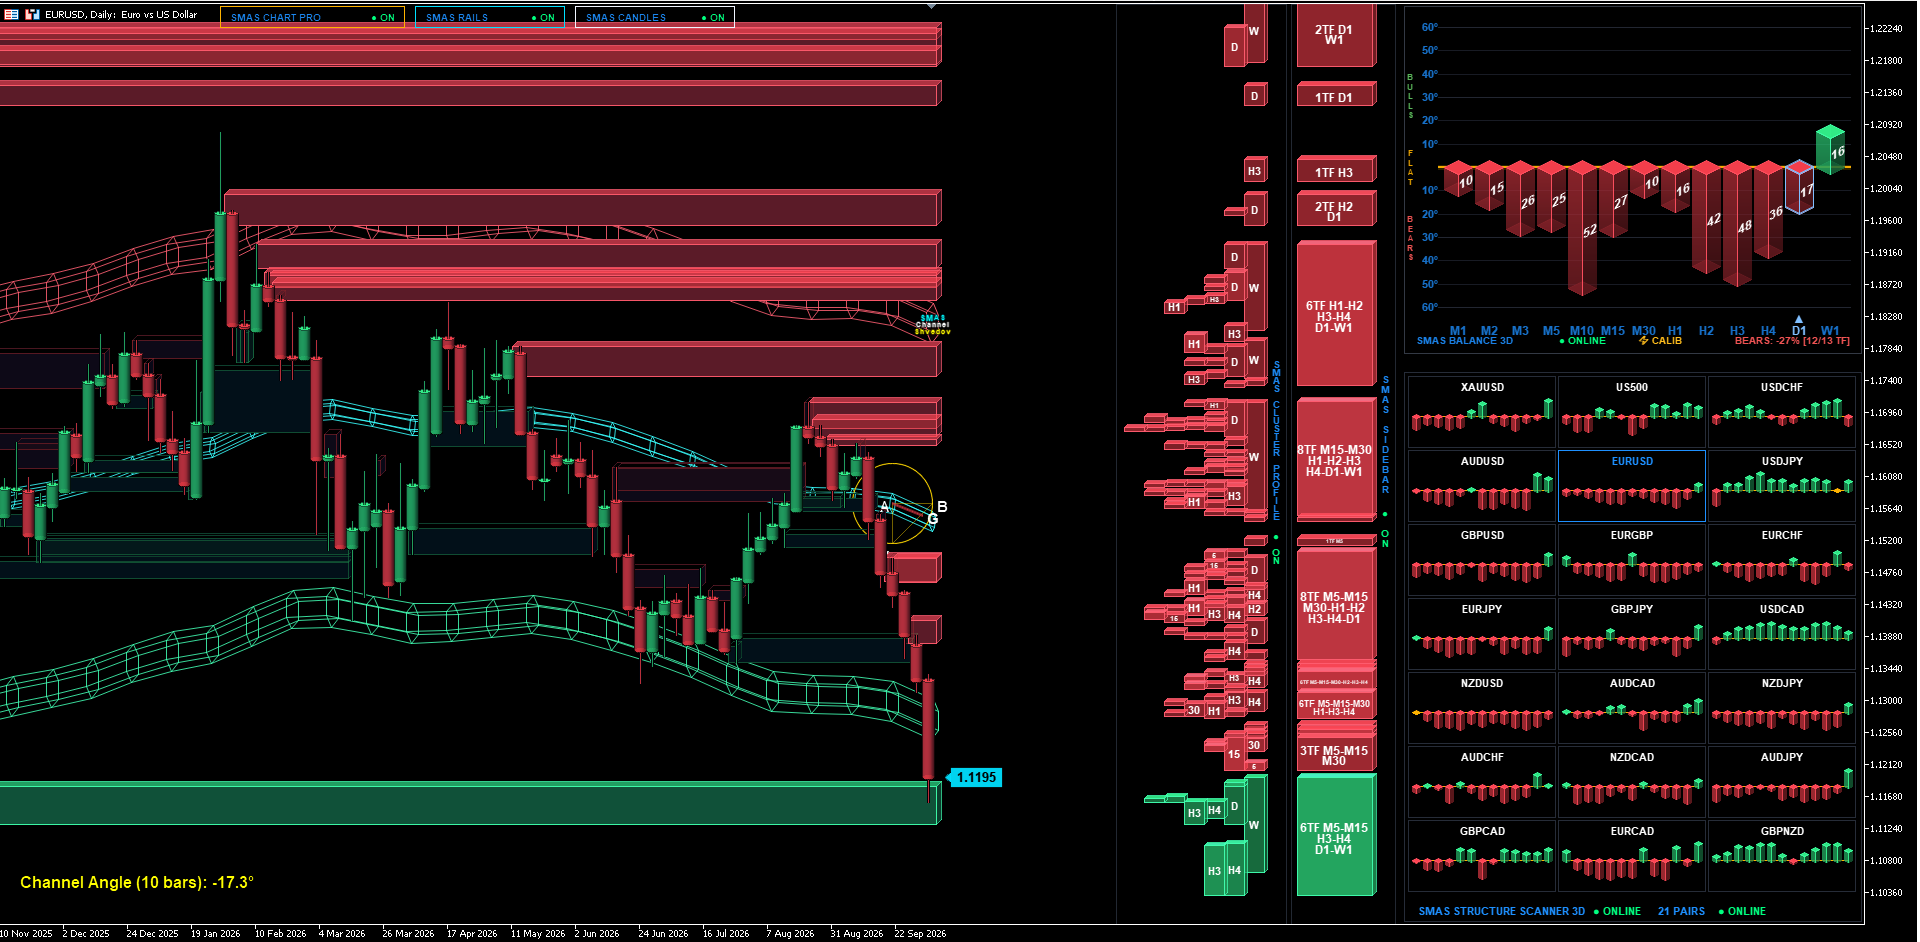
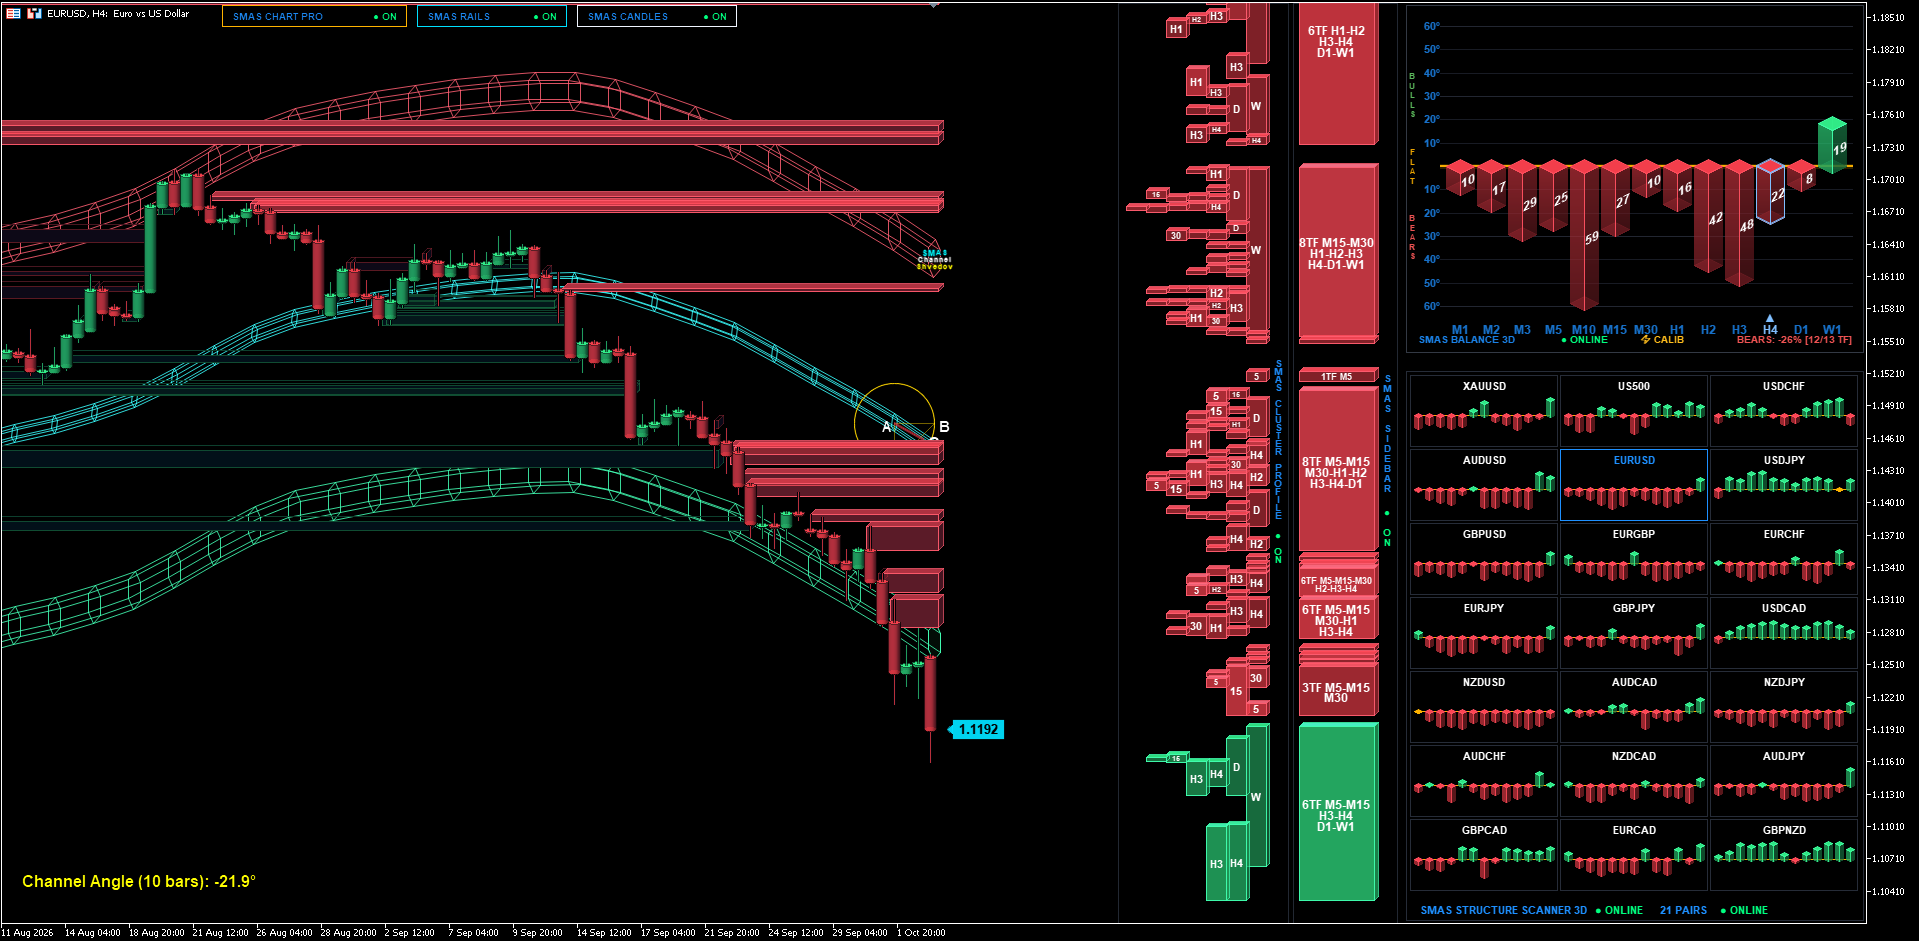
On the intermediate horizons, the market deconstruction illustrates why retail momentum traders are walking into a lethal liquidity trap:
- On the H4 chart, price action has extended to the absolute outer limit of the lower structural boundary rail, printing a steep Channel Angle of -21.9°.
- On the Daily chart, the OLS vector registers a parallel descending gradient of -17.3°.
- However, notice the order book architecture on the SMAS Sidebar 3D: overhead sits an impenetrable fortress of supply — anchored by multiple 8th-Order Super-Clusters (8TF: M5-M15-M30-H1-H2-H3-H4-D1) spanning 1.1550 to 1.1650. This confirms that the downward move was engineered from high-density institutional distribution.
- But now, at 1.1192, the downward liquidity vacuum has terminated. Price has slammed into the lower boundary envelope where 95.45% of Gaussian structural variance is exhausted. The extended lower shadows printed on the current H4 candles confirm active volume absorption by institutional limit buy orders.
C. Phase telemetry (Structure balance 3D): The coiled spring mechanism
Our real-time 14-timeframe structural tensor reveals extreme Phase Desynchronization:
- The entire intraday spectrum is saturated with heavy red selling pressure: M10 (-29%), M15 (-59%), H2 (-42%), H3 (-48%).
- Yet, isolated on the far right of the histogram, the Weekly baseline (W1) stands firmly upright at +19% green.
- This profound dissonance is the mathematical definition of the Spring Compression Pattern: fast intraday selling momentum is physically compressing directly into the immovable macro floor. The moment selling inventory exhausts itself against this 6TF/W1 massif, the spring must decompress violently in the direction of the senior secular trend.
Mathematical execution protocol (The continental rebound long)
Exploiting the terminal kinetic exhaustion of the bearish cascade against the Weekly secular demand floor:
- Execution Setup: High-Convexity Mean-Reversion Long (The Continental Bounce).
- Entry Zone (Long): 1.1190 — 1.1230 (Positioning directly inside the 6TF W1/D1 demand massif upon confirmation of local deceleration).
- Hypothesis Invalidation (Stop Loss): 1.1130 (Placed safely below the multi-year Weekly structural foundation; total risk: 60–70 points).
- Target 1 (Take Profit 1 - 50% Volume): 1.1360 (Test of intermediate 6TF/H4 supply boundary and H1 equilibrium spine; potential: +160 points. Move stop-loss to Breakeven).
- Target 2 (Terminal Target - 50% Volume): 1.1510 (Full mean-reversion rotation toward the primary D1/H4 OLS central equilibrium spine; potential: +310 points).
- Asymmetric Risk / Reward Ratio: 1 : 4.8 (Supreme Institutional Convexity).
Author

Andrey Shvedov
SMAS Quantum Research
Andrey Shvedov is an active quantitative trader, software architect, and financial market researcher with over 24 years of live market microstructure experience.