EUR/USD Analysis: Spike in Call options OI backs bull flag breakout, eyes 1.20?

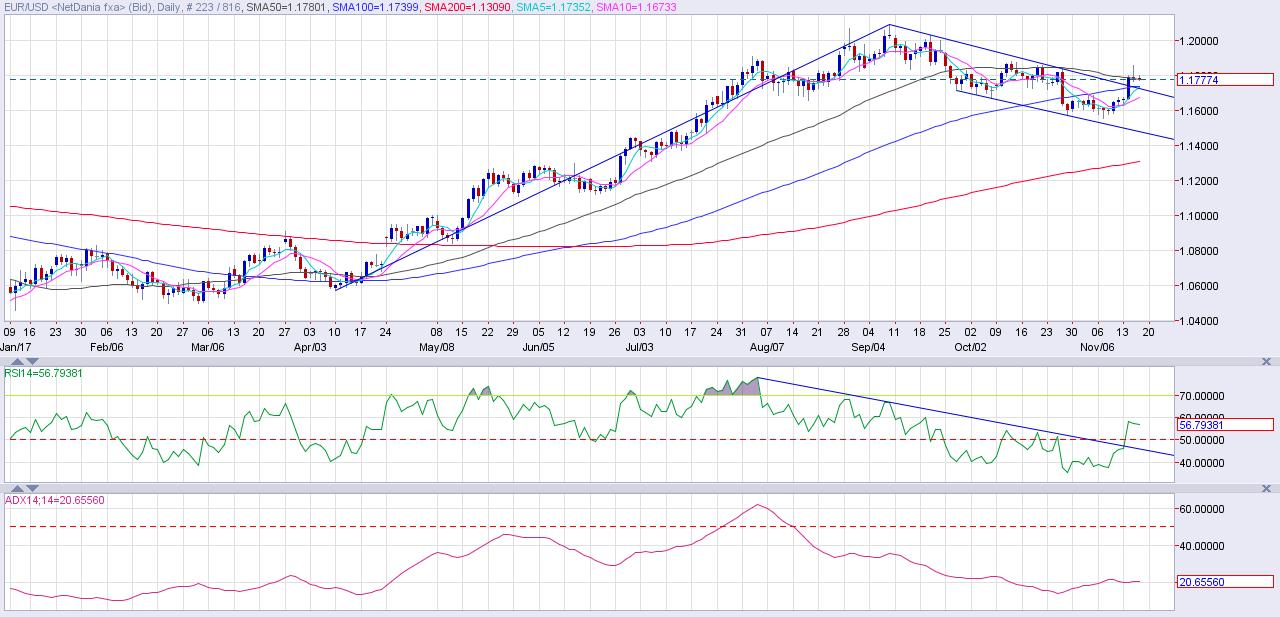
The EUR/USD pair rose to a one-month high of 1.1861 yesterday before ending the day on a negative note at 1.1790. The decline was extended to 1.1768 earlier today, but was short-lived as the spot has moved back above the negatively sloped 50-day MA.
As of writing, the currency pair is trading largely unchanged on the day at 1.1788.
EUR/USD daily chart
Source: CME
The chart above shows-
- Bull flag breakout - It is a bullish continuation pattern, i.e. the rally from the Apr. 10 low of 1.0569 has resumed. Thus, doors are open for a rally to at least 1.20 levels.
- The daily RSI breached the falling trend line and moved above 50.00 (bullish territory). It is currently trending higher in favor of the bulls.
- Also, the ADX line appears to have found a bottom in late October and is slowly moving higher. An uptick in the ADX line indicates the (bullish) trend is gaining strength.
- So, the spot looks set to test 1.20 handle.
The spike in the open interest in the EUR/USD Dec expiry call options further corroborates the bullish view presented by the charts.
EUR/USD EUUZ7 Open Interest Change: Current (Nov 15 - Prelim) vs. Nov 8
| Call Summary | |||||
| Total | ITM | OTM | |||
| OI | Chg | OI | Chg | OI | Chg |
| 73,294 | 3,160 | 29,386 | 1,110 | 43,908 | 2,050 |
| Put Summary | |||||
| Total | ITM | OTM | |||
| OI | Chg | OI | Chg | OI | Chg |
| 81,971 | 1,402 | 6,327 | 228 | 75,644 | 1,174 |
- Over the last one week, the open interest (OI) or open positions in the EUR call options have gone up by 3160 contracts. On the other hand, OI in the put options increased by 1402 contracts. The bias is clearly bullish.
Still, the move towards 1.20 will take time and there are a couple of 'chart-based' factors that could play spoilsport.
For example - Yesterday's was a doji-like candle with a long upper shadow, which highlights bull market exhaustion. Further, the 50-day MA has topped out and that could cap the immediate upside in the pair. However, the slope isn't that steep, hence it could bottom out in 3-4 days if the spot consolidates around 1.1750. A consolidation here would also allow the 10-day MA to catch up with the rising price.
Meanwhile, the weekly 100-MA (1.1650) still carries a negative bias (sloping downwards). The monthly 50-MA (1.1775) is sloping downwards as well. Also, the spot is struggling to break above the same.
View
- The bull flag breakout, indicators and the open interest activity over the last one week do favor a move towards 1.20.
- However, the spot is likely to consolidate around 1.1750 for a few days as indicated by the moving averages.
- Bears are seen regaining control only below the head-and-shoulders neckline level of 1.1675.
Author

Omkar Godbole
FXStreet Contributor
Omkar Godbole, editor and analyst, joined FXStreet after four years as a research analyst at several Indian brokerage companies.


