|

EUR/GBP extends lower within final wave E as bearish momentum builds

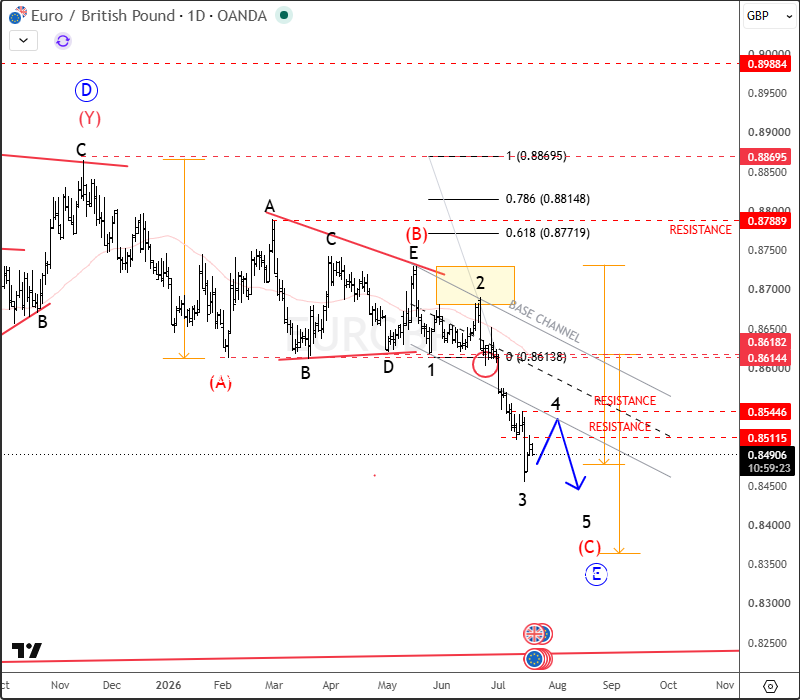
EUR/GBP is moving nicely lower as anticipated back in June, continuing the expected decline after completing the previous corrective structure. The pair is now developing the final wave E, which can take some time to complete, as wave E is expected to unfold in a three-wave (A)(B)(C) structure.

Following the completion of the wave (B) bearish triangle pattern, EURGBP has started a strong decline within the projected wave (C) of E. The current downside structure suggests there is still room for further weakness, with the 0.8400–0.8300 area becoming an important potential target zone. This move could unfold through a lower-degree five-wave bearish impulse, completing the final stages of the larger corrective pattern.
EURGBPd
EURGBP Daily Chart

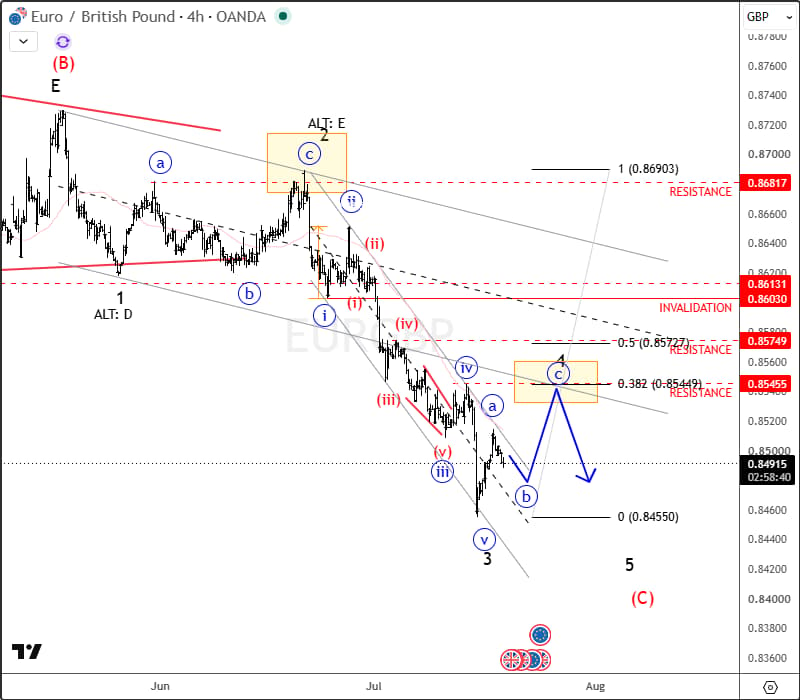
On the 4H chart, EURGBP continues to extend lower as expected, but the current decline may now be approaching the completion of wave v of 3. If this count is correct, we should be alert for a higher-degree wave 4 correction, which could trigger a temporary recovery toward the 0.8545 resistance area before the next leg lower begins within wave 5.
EURGBP4H
EURGBP 4H Chart

As long as the broader bearish structure remains intact, any recovery should be viewed as corrective rather than a trend reversal.


Get Full Access To Our Premium Elliott Wave Analysis For 14 Days. Click here.

Author

Gregor Horvat

Gregor Horvat

Wavetraders

Experience Grega is based in Slovenia and has been in the Forex market since 2003.

More from Gregor Horvat
Share:

Editor's Picks

GBP/USD extends the drop to 1.3360

GBP/USD builds on Monday’s decline and briefly clinches five-day lows near 1.3360 on Tuesday. Cable’s extra pullback follows the better tone in the Greenback as uncertainty in the Middle East prompts investors to adopt a cautious stance. Meanwhile, an apathetic UK labour market report also collaborates with the selling pressure on the British Pound.

EUR/USD looks inconclusive near 1.1420

EUR/USD trades in a tight range in the low 1.1400s on Tuesday, struggling to gain momentum amid an equally absence of clear direction in the US Dollar (USD). Uncertainty surrounding the US-Iran conflict is capping the pair’s upside, while traders avoid taking significant positions ahead of Thursday’s ECB gathering.

Gold shows signs of life; focus is back to $4,100

Gold gains ground on Tuesday, reversing Monday’s pessimism and advancing toward the $4,100 mark per troy ounce. Nevertheless, uncertainty surrounding the Middle East conflict and rising expectations for a hawkish Fed policy outlook are expected to limit the precious metal’s bullish momentum in the near term.

XRP extends recovery as on-chain activity grows
Ripple (XRP) ticks up and trades around $1.13 at the time of writing on Tuesday. This rebound aligns with a broader recovery in the cryptocurrency market, attributed to reports that mediators between the United States (US) and Iran are seeking a 10-day cessation of strikes to find a way back to the signed Memorandum of Understanding (MoU).
The Iranian war has again risen
The Iranian war has again risen to the top of the economics factor list. There is no end in sight. Intelligence experts say the current level of offense/retaliation will not change minds in Tehran, while in Washington, Trump fears all-out war, which would mean boots on the ground.
US Dollar mid-year outlook: Exceptional currency, exceptional risks?
The US Dollar enters the second half of 2026 in a markedly different position from a year ago. The King currency has recovered, reflecting persistent US inflation, changing expectations for Fed policy, geopolitical tensions and renewed demand for defensive assets.
















