|

Elliott Wave view: WTI Crude Oil (CL) eyeing lower range at $68–$73 [Video]

WTI Light Crude Oil (CL) maintains a bearish sequence that began from the May 19, 2026 high. The decline from that peak produced wave 1 at $86.35, followed by a corrective rally in wave 2. This correction unfolded as a zigzag, with wave ((a)) ending at $94.78, wave ((b)) pulling back to $90.12, and wave ((c)) extending higher to $97.02. That move completed wave 2 at a higher degree. Afterward, Oil resumed its decline and broke below the termination of wave 1, confirming the bearish structure.

The downside projection is guided by the 100%–123.6% Fibonacci extension from the May 19 high. This extension aligns with the $68–$73 area, which now represents a potential support zone. From the wave 2 peak, wave ((i)) ended at $89.68, while wave ((ii)) rallied to $95.47. Oil then extended lower again, forming a nested sequence. Within this structure, wave (i) of ((iii)) ended at $85.95, and wave (ii) of ((iii)) rallied to $93.64. The market has since resumed its decline, keeping the bearish outlook intact.

Light Crude Oil (CL_F) 60-minute Elliott Wave chart

Chart

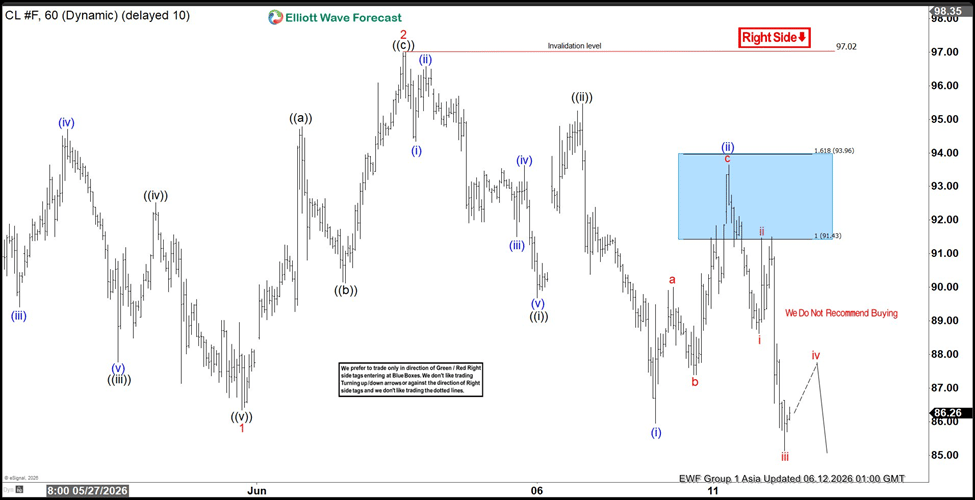
Near term, as long as price remains below $97.02, rallies are expected to fail in either three or seven swings. This reinforces the probability of continued downside pressure. The technical view highlights the likelihood of Oil extending lower toward the $68–$73 zone, consistent with the broader bearish sequence.

CL_F Elliott Wave Video

Youtube preview

Author

Elliott Wave Forecast Team

Elliott Wave Forecast Team

ElliottWave-Forecast.com

More from Elliott Wave Forecast Team
Share:

Editor's Picks

AUD/USD falls from 0.7050 amid Iran uncertainty

AUD/USD is back in the red, falling from 0.7050 in the Asian session on Friday, reversing the previous day's goodish rebound from a nearly two-month low amid a modest US Dollar uptick. Iran downplayed Trump's claim that a deal has been approved and said that key issues, including the Strait of Hormuz and frozen funds, remain unresolved. This keeps a lid on optimism, which, along with Fed rate-hike bets, revives USD demand and weighs on the pair.

USD/JPY recovers above 160.00 as Mideast woes persist ahead of BoJ

USD/JPY recovers ground above 160.00 in the Asian session on Friday. Economic risks due to uncertainty in the Middle East undermine the Japanese Yen, while lifting the safe-haven US Dollar (USD) amid the US-Iran standoff. This acts as a tailwind for the pair, though fears of intervention could limit deeper JPY losses and cap the pair's rebound ahead of the BoJ meeting next week.

Gold sticks to losses amid Iran peace deal doubts and hawkish Fed bets

Gold attracts some sellers near the $4,246-$4,247 region during the Asian session, stalling the previous day's solid recovery move from its lowest level since November 2025. Mixed signals regarding a potential US-Iran peace deal revive demand for the safe-haven US Dollar.

Pi Network: Bulls attempt comeback as bearish strength fades

Pi Network (PI) is trading at around $0.120 after a modest recovery the previous day. Despite this recent rebound, traders should be cautious as a scheduled unlock of 14.8 million PI tokens on Friday could limit the token's recovery potential by increasing market supply. Meanwhile, the technical outlook is showing early signs of fading bearish momentum, suggesting a short-term bounce.

U.S. economic outlook: The Warsh era starts with a great debate

Warsh is starting his tenure at the Fed during a transition of sorts. Given the prior FOMC statement and the countless Fed speakers we’ve heard from since then, it seems Fed officials are in the midst of shifting toward a more neutral policy stance.

4.2% headline, 0.2% core: Why the Fed's next hike may be targeting the wrong problem

May's CPI put headline inflation at 4.2% on the year, up from 3.8% in April and the hottest reading since April 2023, while core prices rose just 0.2% on the month, undershooting the 0.3% consensus and halving April's pace.