|

Elliott Wave outlook: GDX approaches key support zone $78.6– $82 range

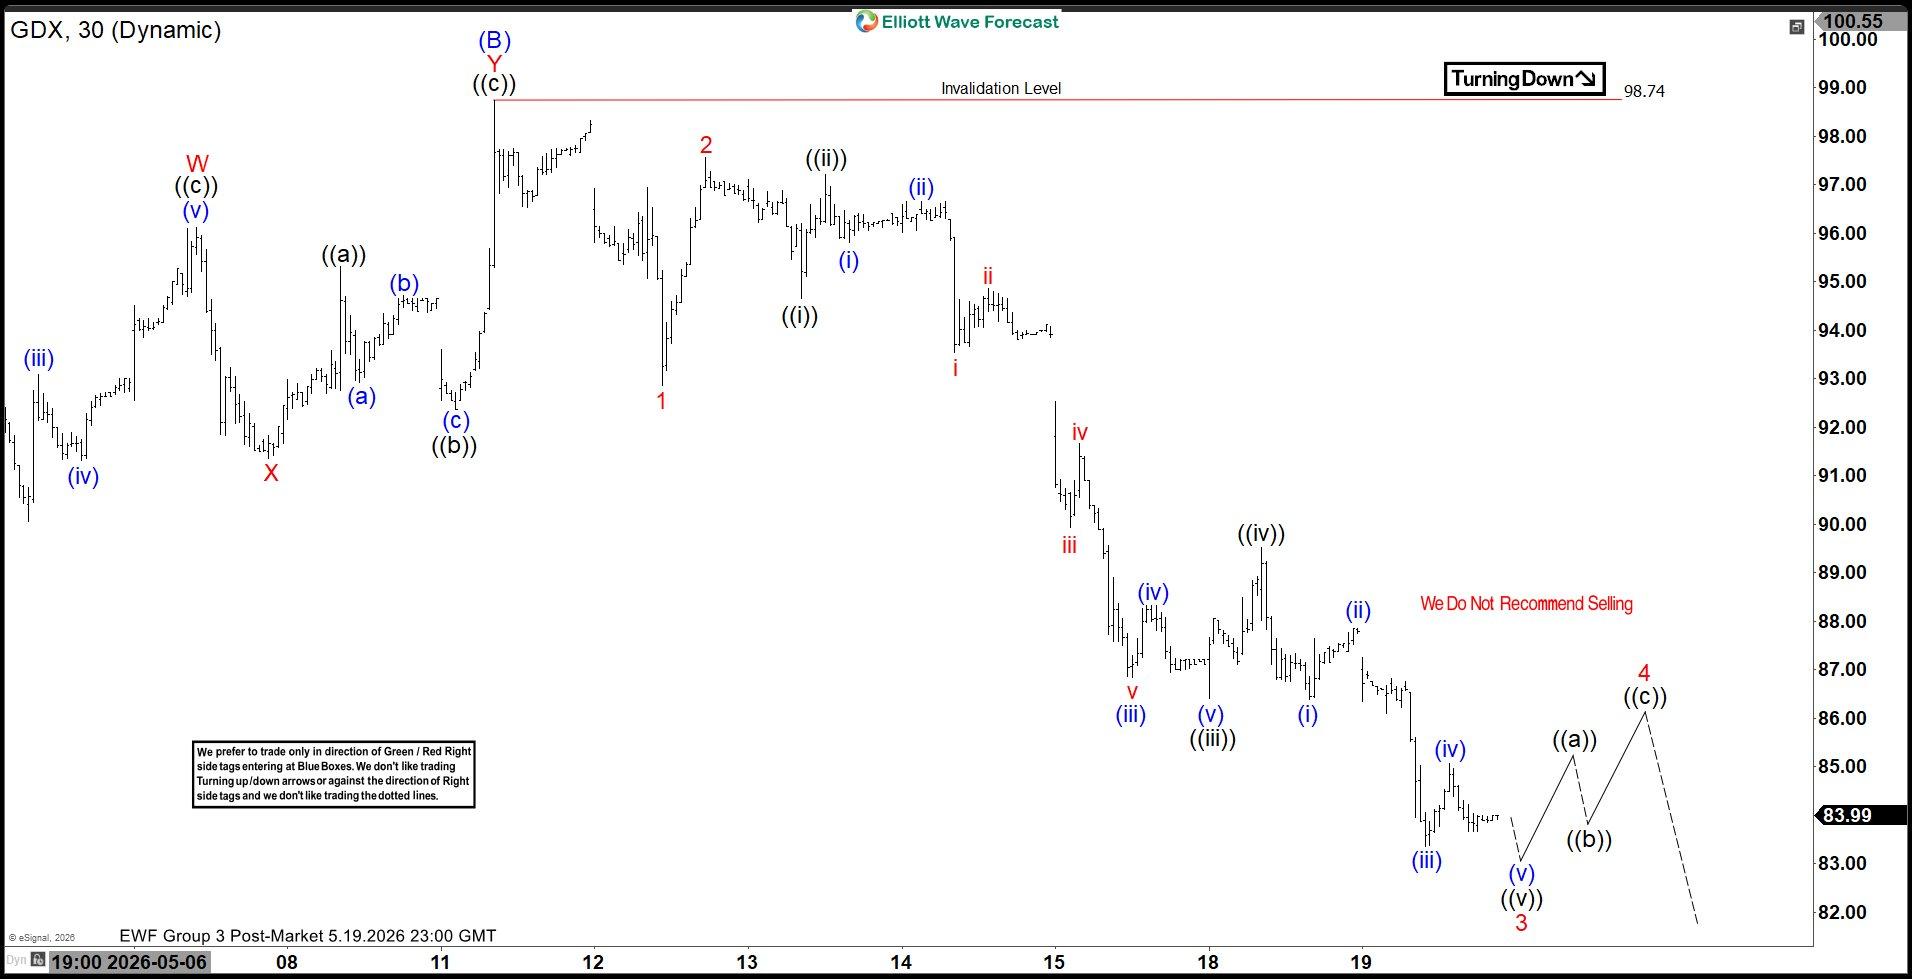
The short‑term Elliott Wave outlook for Gold Miners ETF (GDX) shows a correction unfolding from the March 20, 2026 low. This move is developing as a zigzag structure, a common three‑wave corrective pattern. From the March 20 high, wave (A) ended at $85.46, followed by a rally in wave (B) that reached $98.74. The ETF has since turned lower, with wave (C) now in progress and subdividing into five smaller waves.

From the peak of wave (B), wave 1 concluded at $92.85. A corrective rally in wave 2 then advanced to $97.56. The ETF extended lower in wave 3, which is expected to finish soon. Afterward, a rally in wave 4 should emerge, likely in three or seven swings, before a final decline in wave 5 completes wave (C). The downside target aligns with the 100% Fibonacci extension of wave (A) and the prior pivot low of March 20, 2026. This area falls between $78.74 and $81.90, forming a critical support zone.

Near term, as long as price remains below $98.74, GDX retains scope to extend modestly lower before stabilizing. A decisive break beneath $78.74, however, would imply that the correction is evolving into a larger double structure. This scenario highlights the importance of monitoring Fibonacci projections and prior pivots to anticipate the next directional move.

Gold Miners ETF (GDX) 60-Minute Elliott Wave Chart
 

GDX Elliott Wave video:
Youtube preview

Author

Elliott Wave Forecast Team

Elliott Wave Forecast Team

ElliottWave-Forecast.com

More from Elliott Wave Forecast Team

Share:

Editor's Picks

GBP/USD retreats below 1.3350; Fed Minutes in focus

GBP/USD struggles to find its footing and trades in negative territory below 1.3350, pressured by the renewed USD strength. US President Donald Trump said on the MoU signed with Iran to end the conflict was "over", causing safe-haven flows to dominate the action in financial markets. Later in the American session, the Fed will publish the minutes of the June policy meeting.

EUR/USD tests 1.1400 as USD gathers strength on Trump comments

EUR/USD comes under bearish pressure on Wednesday and declines toward 1.1400. US President Trump said the MoU signed with Iran to end the conflict was "over" and added that the didn't want to engage with Tehran anymore, triggering a flight-to-safety and boosting the USD.

Gold drops below $4,100 as Middle East tensions escalate

Gold turns south on Wednesday and trades deep in negative territory near $4,050 on Wednesday. Investors adopt a cautious stance and help the USD gather strength after US President Trump said at the NATO summit that the MoU signed with Iran to end the conflict was "over" and added he didn't want to engage with Tehran.

Pi Network crashes to a record low amid broader market stress

Pi Network (PI) price edges toward $0.1000 extending losses for the fifth straight day. Retail sentiment remains bearish as Open Interest and the funding rate decline. The technical outlook for PI is bearish as selling pressure mounts, despite oversold conditions.

WTI surges above $74 as Trump confirms MoU with Iran is over

West Texas Intermediate (WTI) soars 3.2% to near $74.30 during the European trading session, the highest level seen in two weeks. The oil price surges as the confirmation, from the US President Donald Trump that the MoU with Iran is over, has revived risks of global energy supply disruption.

Bye, forward guidance: How to trade when central banks choose silence

Central banks have spent years telling markets what might come next. Now, traders face the possibility that they say a lot less. From the Federal Reserve to the European Central Bank and the Bank of England, policymakers are pushing back against forward guidance.