DXY price outlook: US Dollar Index tests 1.236 resistance arc, awaiting directional confirmation

US Dollar Index (DXY): Arc cycle analysis™
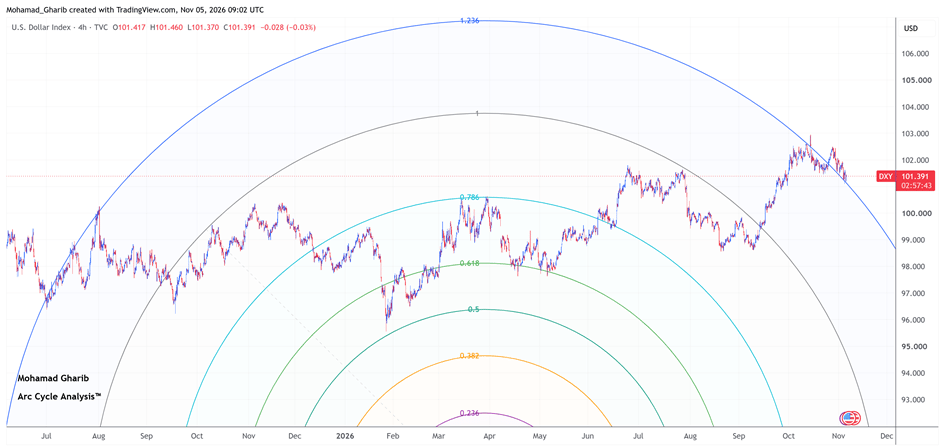
Figure 1: DXY 4h chart with Arc Cycle levels. U.S. Dollar Index (DXY) on the 4h chart with the Arc Cycle levels used in this analysis. Source: TradingView chart; Arc Cycle Analysis™ by Mohamad Gharib.
Overview
Based on Arc Cycle Analysis applied to the 4h chart, the U.S. Dollar Index is interacting with the 1.236 Resistance Arc within the current Arc Cycle. This Arc is acting as a strong resistance, and price is awaiting a directional move.
Table 1: DXY arc cycle analysis summary
Metric | Reading |
Market Bias | Neutral |
Preferred Scenario | Awaiting Directional Confirmation |
Arc Integrity | Strong Resistance |
Current Arc Level | Resistance Arc (1.236) |
Cycle Status | Testing Resistance Arc |
Market Outlook
Price is testing the 1.236 Resistance Arc, which continues to act as a strong resistance within the current Arc Cycle. The market has not yet established a directional bias, and the next move depends on whether price rebounds from this Arc or breaks above it. No signal has been confirmed yet, and the preferred approach is to await a clear reaction at the Arc before anticipating the next move.
Author

Mohamad Gharib
Independent Analyst
Mohamad Gharib is a Financial Markets Analyst and Quantitative Researcher with more than 18 years of experience in financial markets, including 15 years as an FX Quant Trader.