Dollar remains on the back foot

EUR/USD:
Weekly timeframe:
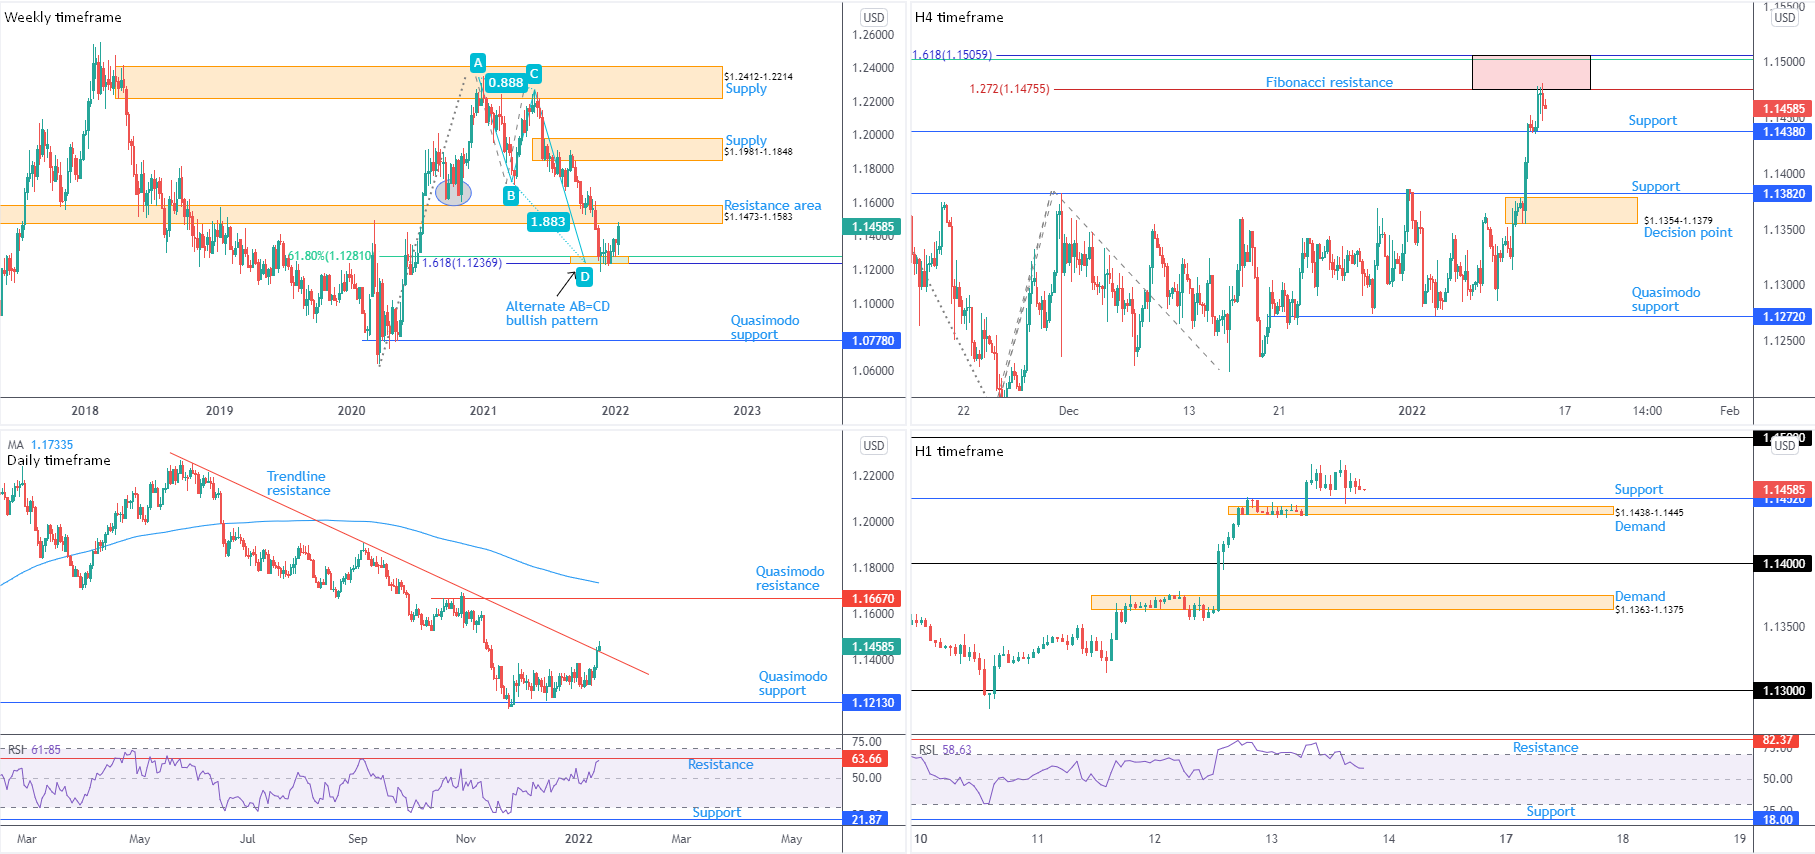
Buyers eventually regained consciousness from support at $1.1237-1.1281—made up of a 61.8% Fibonacci retracement at $1.1281 and a 1.618% Fibonacci projection from $1.1237. ‘Harmonic’ traders will acknowledge $1.1237 represents what’s known as an ‘alternate’ AB=CD formation (extended D leg).
Consequently, resistance elbowed into the spotlight at $1.1473-1.1583 on Thursday. In light of its long-standing position (S/R since late 2017), sellers making a show from here is (technically speaking) a reasonable assumption.
Adding to the above, the pair took out 2nd November low (2020) at $1.1603 in late September (2021), suggesting the early stages of a downtrend on the weekly timeframe. This is reinforced by the monthly timeframe’s primary downtrend since mid-2008.
Daily timeframe:
A closer reading of price action on the daily timeframe, however, reveals the 7-month trendline resistance welcomed a breach, extended from the high $1.2254. Additional recovery gains emerging on the back of this shines the technical spotlight on Quasimodo resistance at $1.1667, shadowed by the 200-day simple moving average at $1.1734.
Regarding momentum, the relative strength index (RSI) is on the doorstep of indicator resistance at 63.66, tucked just under overbought territory.
Trend on this scale has been lower since June 2021. A decisive breach of the noted trendline, nonetheless, could alter this bias.
H4 timeframe:
Weakening US Treasury yields and sustained softness across the dollar space Thursday lifted EUR/USD from support at $1.1438 to Fibonacci resistance between $1.1506 and $1.1476. Note that the 1.272% Fibonacci projection at $1.1476 is commonly referred to as an ‘alternate’ AB=CD formation (extended D leg).
The Fibonacci zone overlapping the lower edge of weekly resistance from $1.1473-1.1583 echoes a bearish tone and may weigh on upside attempts north of daily trendline resistance.
H1 timeframe:
Quasimodo resistance-turned support at $1.1452 (plotted above demand at $1.1438-1.1445) entered the frame heading into US hours on Thursday, commanding attention to the $1.15 figure overhead.
Following the near-test of resistance at 82.37 on the relative strength index (RSI), the indicator’s value departed overbought space and highlights the possibility of the 50.00 centreline being challenged.
Observed Technical Levels:
Long term, we’re at the lower boundary of weekly resistance at $1.1473-1.1583, structure perhaps hindering further buying beyond the daily timeframe’s 7-month trendline resistance, extended from the high $1.2254.
Also of technical interest is active H4 Fibonacci resistance between $1.1506 and $1.1476 fastened to the underside of weekly resistance. H1, as you can see, exhibits scope to approach $1.15 from support at $1.1452.
In light of weekly and H4 resistance likely overriding the H1 and daily timeframes suggesting buying, chart studies indicate bears may make an appearance, targeting H4 support at $1.1438, followed by $1.14 on the H1.
AUD/USD:
Weekly timeframe:
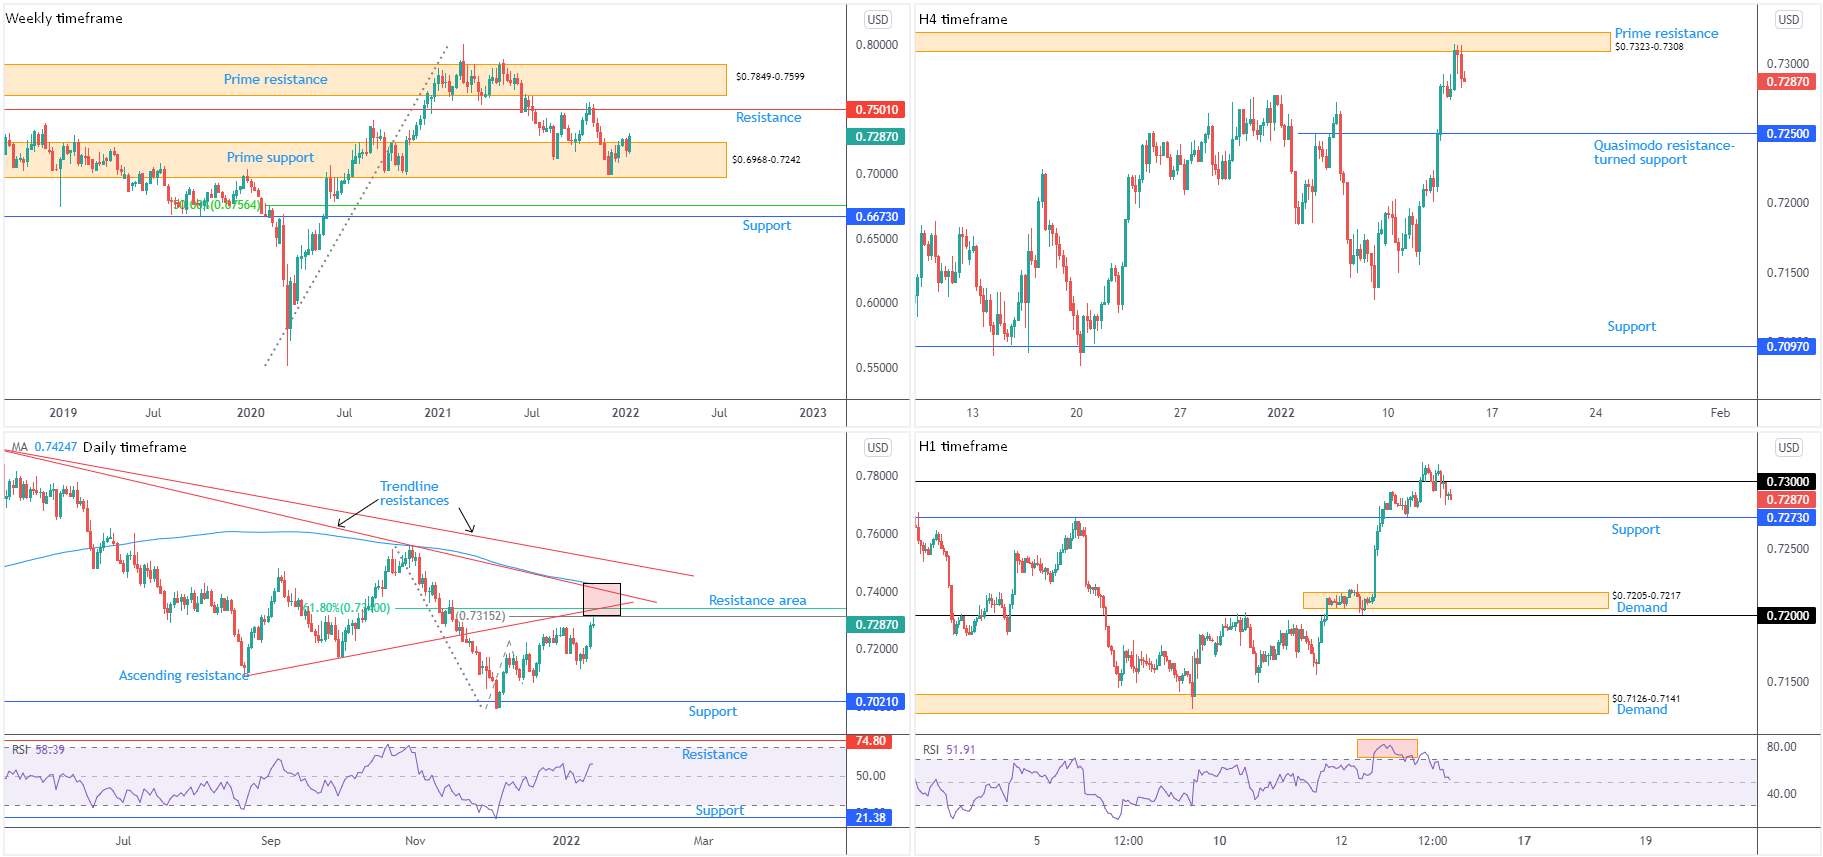
Prime support at $0.6968-0.7242 continues to play a crucial role on the weekly timeframe. Bulls, as you can see, welcomed a bullish phase into the close of 2021. Should buyers continue pressing higher, resistance is formed at $0.7501.
Manoeuvring beneath $0.6968-0.7242 reveals support at $0.6673 and a 50.0% retracement at $0.6756.
Since mid-Feb 2021, a downside bias has been seen, following higher prices since pandemic lows of $0.5506 (March 2020). However, from the monthly timeframe the unit has been entrenched within a large-scale downtrend from mid-2011.
Daily timeframe:
Resistance—made up of a 61.8% Fibonacci retracement at $0.7340, a 100% Fibonacci projection at $0.7315, an ascending resistance, drawn from the low $0.7106, trendline resistance, drawn from the high $0.7891, and the 200-day simple moving average at $0.7425—came within a pip of making an entrance on Thursday before the currency pair finished the session off best levels.
Aside from the $0.7130 low, obvious support at $0.7021 calls for attention to the downside.
The relative strength index (RSI) has shaped 50.00 centreline support, action informing traders and investors that average gains surpass average losses: positive momentum. Indicator resistance is visible at 74.80.
H4 timeframe:
Prime resistance drawn from $0.7323-0.7308 was tested on Thursday, arranged within the lower limit of daily resistance mentioned above between $0.7425 and $0.7315.
Continued interest lower down places Quasimodo resistance-turned support on the radar at $0.7250.
H1 timeframe:
As evident from the H1 chart, short-term action whipsawed above $0.73 to test the H4 timeframe’s prime resistance at $0.7323-0.7308. This appears to have been a ‘typical’ stop run on ‘buy-stops’ above the psychological figure. Technicians will also see the stop-run was accompanied by the relative strength index (RSI) producing bearish divergence. The indicator is now closing in on the 50.00 centreline.
Lower on the curve on the H1, support is at $0.7273, with subsequent bearish interest beneath here underlining demand at $0.7205-0.7217.
Observed Technical Levels:
The near-test of daily resistance between $0.7425 and $0.7315, and sellers drawing from H4 prime resistance at $0.7323-0.7308, as well as the H1 stop-run above $0.73, could lead price action lower in the short term. H1 closing under support at $0.7273 suggests further selling to H1 demand at $0.7205-0.7217.
USD/JPY:
Weekly timeframe:
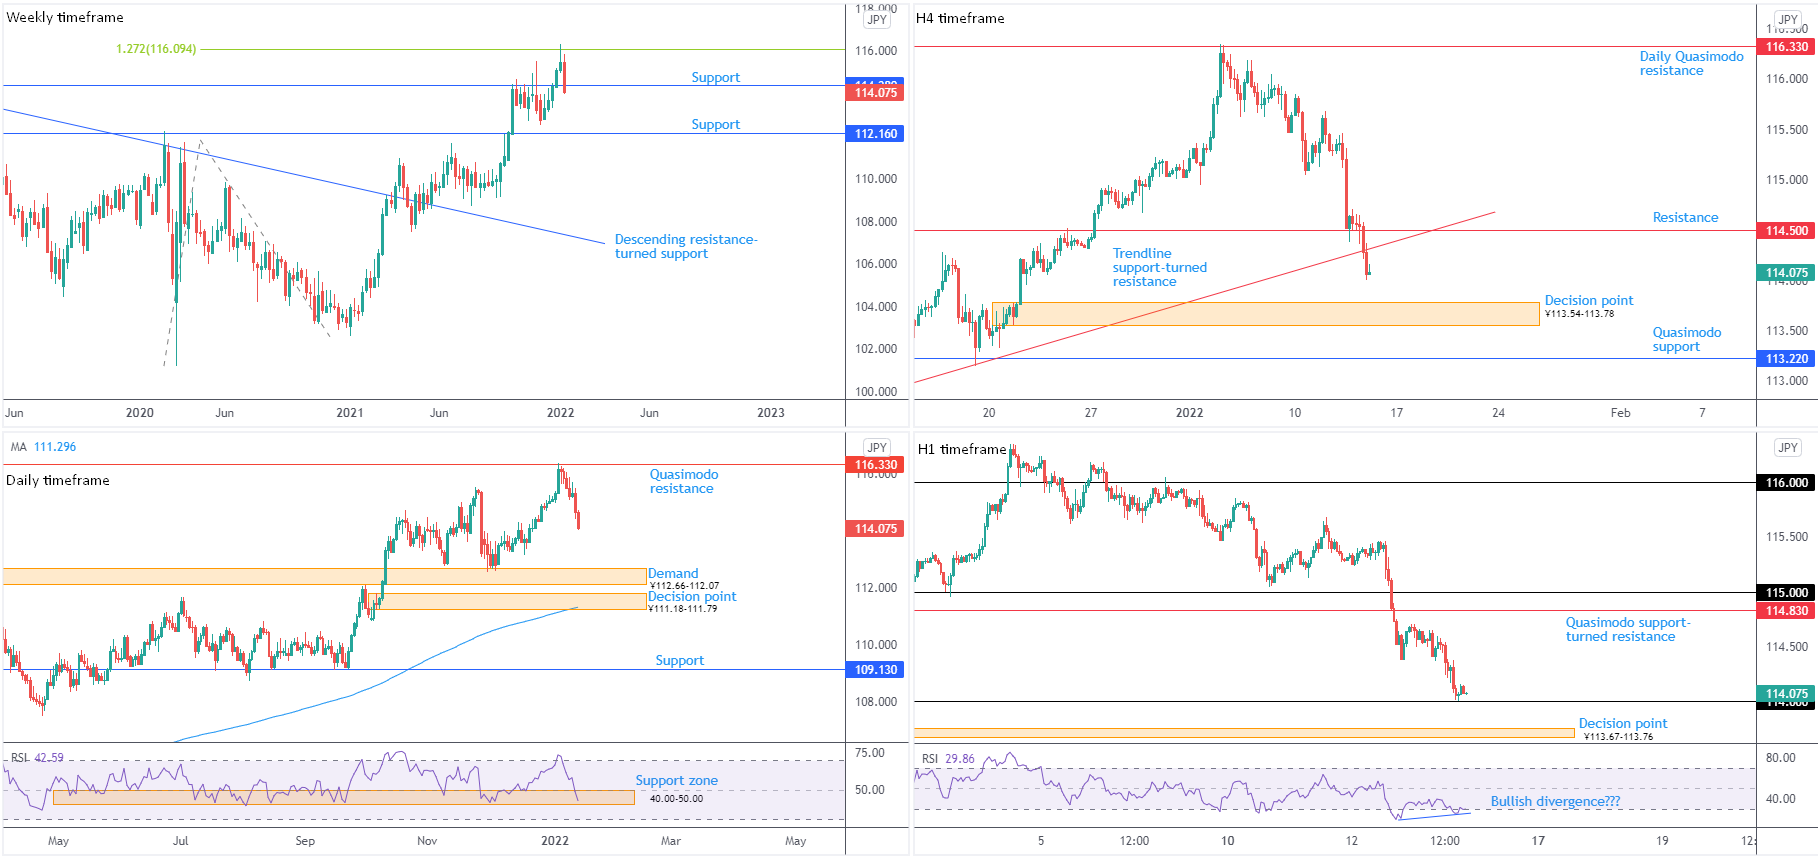
After touching gloves with a 1.272% Fibonacci projection from ¥116.09 and refreshing multi-year pinnacles, bearish movement travelled under resistance-turned support from ¥114.38. Support at ¥112.16, therefore, warrants attention as the next downside objective on this scale.
In terms of trend, the unit has been advancing since the beginning of 2021, welcoming a descending resistance breach, drawn from the high ¥118.61.
Daily timeframe:
Technically aiding bearish action is the daily timeframe’s Quasimodo resistance at ¥116.33. Technical studies point to additional loss in this market until crossing swords with demand at ¥112.66-112.07, tailed closely by a decision point from ¥111.18-111.79 and the 200-day simple moving average at ¥111.30.
In terms of the relative strength index (RSI), support between 40.00 and 50.00 (a ‘temporary’ oversold range since 10th May) is active.
H4 timeframe:
Trendline support, taken from the low ¥112.56, was overthrown amid US trading on Thursday, exacerbating the ongoing decline seen so far this week.
The ¥113.54-113.78 decision point demands attention, with a break perhaps propelling the unit towards Quasimodo support at ¥113.22.
H1 timeframe:
The ¥114 psychological figure greeted price in recent hours and developed a modest intraday floor of support, reinforced by the relative strength index (RSI) constructing potential bullish divergence (traders are likely waiting for the indicator to exit oversold terrain).
Asia trading may continue to form support off ¥114, though heading into London and early US trading (retail sales figures) additional liquidity may squeeze remaining bids from the market and proceed in the direction of the decision point at ¥113.67-113.76.
Observed Technical Levels:
Weekly, daily and H4 timeframes leaning towards lower prices could pull H1 sub ¥114 to the decision point at ¥113.67-113.76.
GBP/USD:
Weekly timeframe:
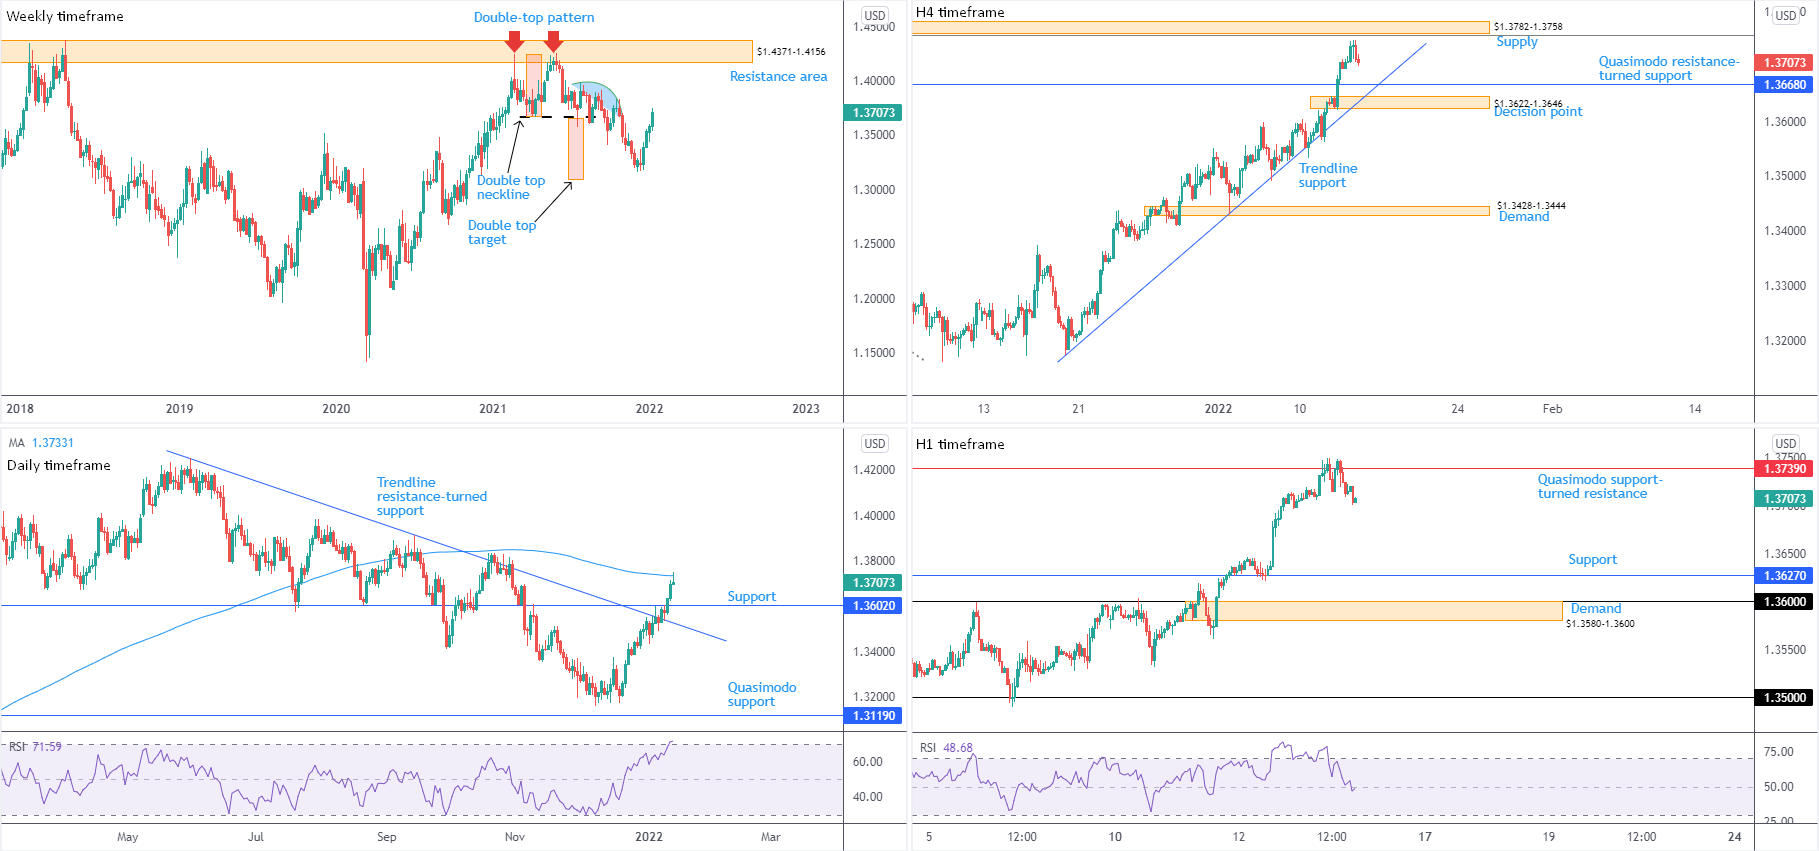
The current 4-week bid—initiated ahead of the double-top pattern’s ($1.4241) profit objective around $1.3093 (red boxes)—continues to echo a muscular tone, in line with the weekly timeframe’s current uptrend since early 2020. However, it’s important to recognise that while the trend on the weekly timeframe demonstrates an upside bias, the monthly timeframe’s long-term trend has been lower since late 2007.
‘Consumed supply’ (blue area) is nearby between $1.4001 and $1.3830. Considering this, candle action may be guided as far north as resistance from $1.4371-1.4156.
Daily timeframe:
Thursday shook hands with the 200-day simple moving average at $1.3733, following two back-to-back bullish days that not only confirmed trendline resistance-turned support, taken from the high $1.4250, but also dethroned $1.3602 resistance.
Technical eyes will also acknowledge Thursday’s response from the noted SMA finished in the shape of a shooting star candle, a bearish signal among candlestick enthusiasts.
The relative strength index (RSI), unsurprisingly, recorded overbought conditions yesterday. Note the indicator has not visited overbought since February 2021.
H4 timeframe:
A handful of pips ahead of supply from $1.3782-1.3758 and a deep 88.6% Fibonacci retracement at $1.3758, GBP/USD rotated lower at the tail end of Thursday’s session. This highlights steep trendline support, drawn from the low $1.3173, Quasimodo resistance-turned support at $1.3668 and a decision point at $1.3622-1.3646.
H1 timeframe:
Alongside the relative strength index (RSI) registering overbought conditions, H1 price tested Quasimodo support-turned resistance at $1.3739 and held into the closing bell Thursday. Downside targets rest at support from $1.3627, the $1.36 psychological figure and demand at $1.3580-1.3600.
RSI analysis also dropped through the 50.00 centreline ahead of the close, informing short-term traders that average losses in this market exceed average gains: negative momentum.
Observed Technical Levels:
The daily timeframe connecting with the 200-day simple moving average at $1.3733 and forming a shooting star candlestick pattern bolsters further selling on the H1 scale from Quasimodo support-turned resistance at $1.3739 towards H1 support at $1.3627. Though before reaching this far south, traders will consider H4 support at $1.3668 and H4 trendline support, drawn from the low $1.3173.
Author

Aaron Hill
FP Markets
After completing his Bachelor’s degree in English and Creative Writing in the UK, and subsequently spending a handful of years teaching English as a foreign language teacher around Asia, Aaron was introduced to financial trading,


