Dollar Index probing daily trendline support, EUR/USD and AUD/USD pairs boosted

EUR/USD:
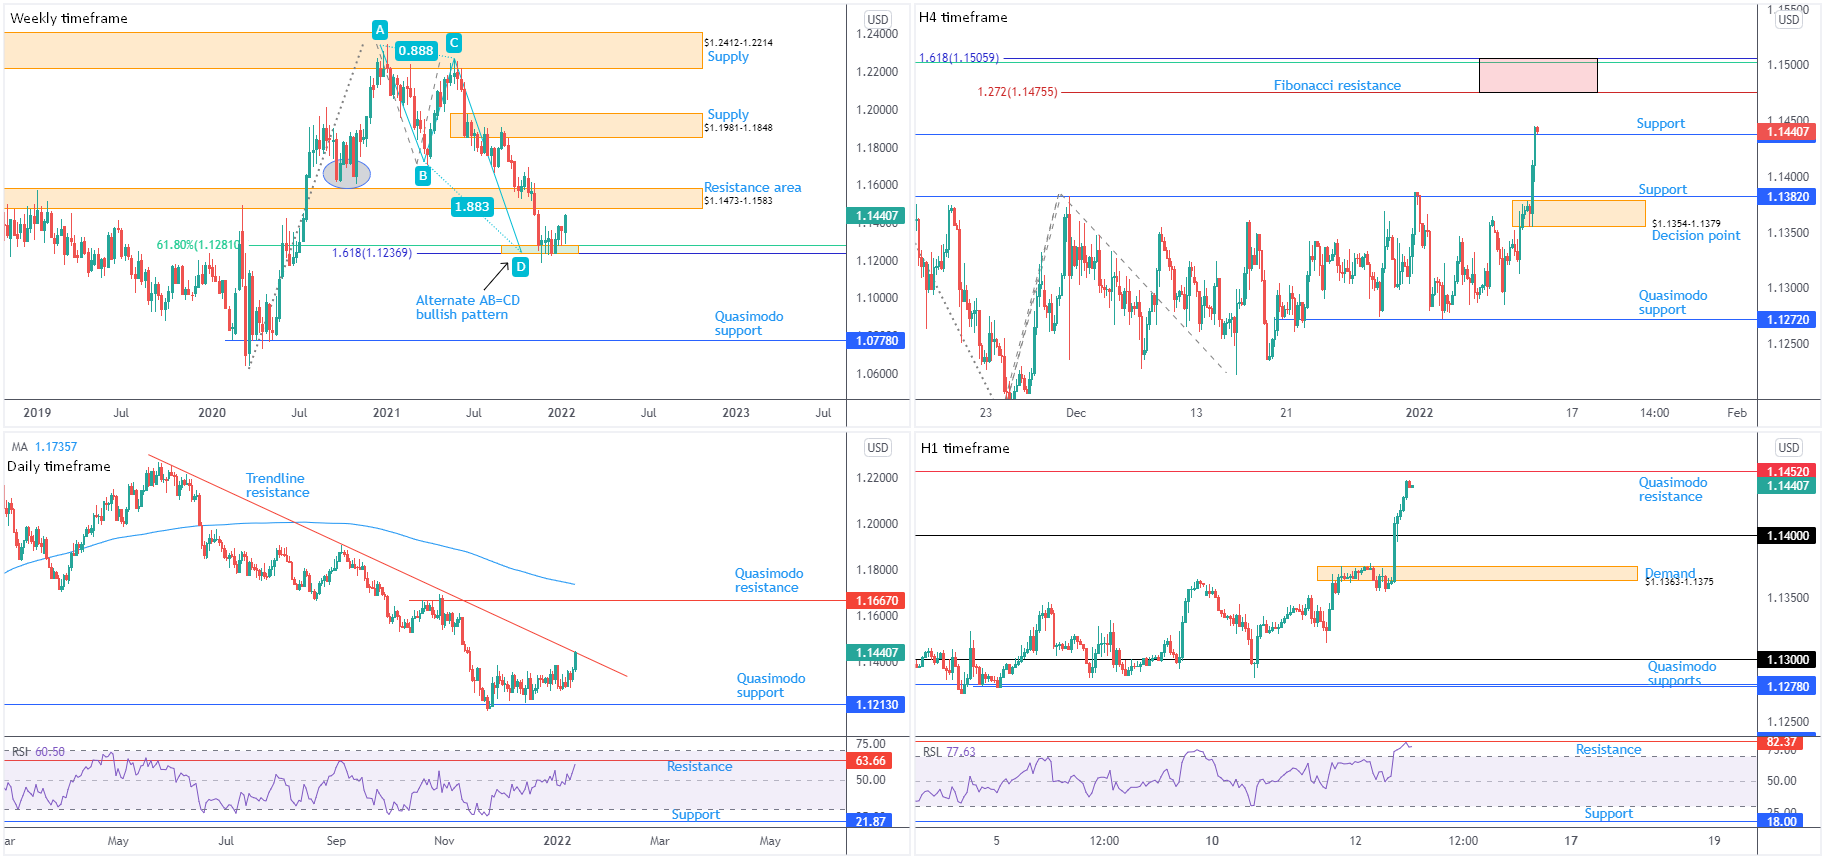
Weekly timeframe:
Since mid-November (2021), buyers and sellers have been squaring off around support at $1.1237-1.1281—made up of a 61.8% Fibonacci retracement at $1.1281 and a 1.618% Fibonacci projection from $1.1237. ‘Harmonic’ traders will acknowledge $1.1237 represents what’s known as an ‘alternate’ AB=CD formation (extended D-leg).
Any upside derived from current support will likely be capped by resistance at $1.1473-1.1583; navigating lower, on the other hand, throws light on Quasimodo support as far south as $1.0778.
Interestingly, despite current support, the pair took out 2nd November low (2020) at $1.1603 in late September (2021), suggesting the early stages of a downtrend on the weekly timeframe. This is reinforced by the monthly timeframe’s primary downtrend since mid-2008.
Daily timeframe:
Quasimodo support drawn from mid-June at $1.1213 (positioned beneath the weekly timeframe’s Fibonacci structure) made an entrance on 24th November (2021) and remains committed. Trendline resistance, extended from the high $1.2254, remains overhead.
Analysis out of the relative strength index (RSI) reveals the value attempting to establish support from the 50.00 centreline: positive momentum. Indicator resistance resides at 63.66, tucked just under the overbought threshold of 70.00.
Trend on this scale has been lower since June 2021.
H4 timeframe:
Key levels to be mindful of on the H4 scale:
Quasimodo support from $1.1272.
Resistance at $1.1379, accompanied by a 38.2% Fibonacci retracement at $1.1381. Note these levels are now close by.
Beyond resistance, a 100% Fibonacci projection is visible at $1.1422 (AB=CD bearish pattern), followed by Quasimodo support-turned resistance at $1.1438. Lower on the curve, support falls in around $1.1235.
H1 timeframe:
Out of the H1 chart, technicians will note short-term flow currently touching resistance at $1.1364. Overhead, H4 resistance is seen at $1.1379, sharing chart space with a 100% Fibonacci projection at $1.1381 and a 1.618% Fibonacci extension at $1.1376 (as well as the H4 timeframe’s 38.2% Fibonacci retracement at $1.1381).
Alongside the above technical resistance, the relative strength index (RSI) is on the doorstep of overbought levels. Indicator resistance is also present at 82.37.
Observed Technical Levels:
Weekly Fibonacci support between $1.1237 and $1.1281 interacting with price may be enough to pull daily action to trendline resistance, extended from the high $1.2254. In view of the daily timeframe trending lower since June 2021, traders are urged to pencil in the possibility of a bearish attempt from the noted trendline resistance.
Short term, H4 resistance at $1.1379 is key right now, a level reinforced by a number of Fibonacci points on H1 and H4 timeframes (see above).
AUD/USD:
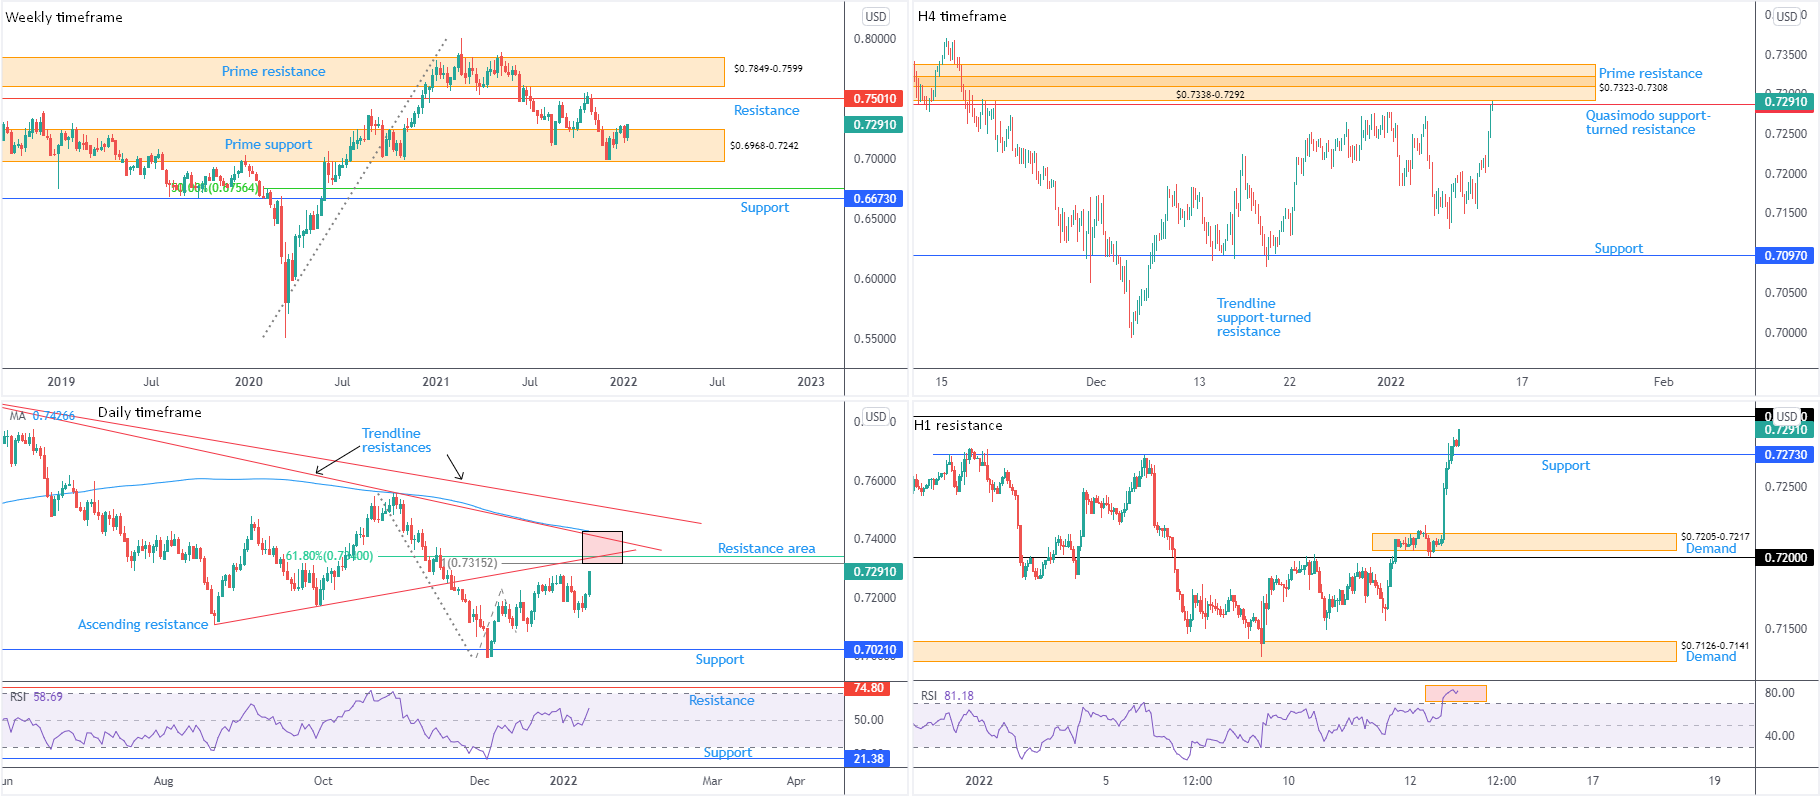
Weekly timeframe:
Prime support at $0.6968-0.7242 continues to play a crucial role on the weekly timeframe. Bulls, as you can see, welcomed a bullish phase into the close of 2021, though appetite for higher prices subsided last week. Should buyers regain footing, resistance is formed at $0.7501; manoeuvring beneath $0.6968-0.7242 reveals support at $0.6673 and a 50.0% retracement at $0.6756.
Since mid-Feb 2021, a downside bias has been seen, following higher prices since pandemic lows of $0.5506 (March 2020). However, from the monthly timeframe the unit has been entrenched within a large-scale downtrend from mid-2011
Daily timeframe:
Resistance—made up of a 61.8% Fibonacci retracement at $0.7340, a 100% Fibonacci projection at $0.7315, an ascending resistance, drawn from the low $0.7106, and trendline resistance, drawn from the high $0.7891—offers healthy (technical) confluence on this chart. Support at $0.7021 calls for attention to the downside in the event sellers track lower price levels.
The relative strength index (RSI) is seen attempting to make room above the 50.00 centreline, action informing traders and investors that average gains surpass average losses: positive momentum.
H4 timeframe:
As of current trade (US afternoon Tuesday), the currency pair is within a stone’s throw from trendline support-turned resistance, taken from the low $0.6993, and a 61.8% Fibonacci retracement at $0.7222. Furthermore, an AB=CD bearish formation is positioned within the aforementioned zone (black arrows), adding weight to the zone.
Assuming a resistance breach, the technical pendulum swings in favour of a continuation to Quasimodo support-turned resistance at $0.7287.
H1 timeframe:
In conjunction with H4 resistances, H1 dethroning $0.72 unlocks the technical door towards Quasimodo support-turned resistance at $0.7229 which dovetails closely with H4 levels.
On top of said resistances, the relative strength index (RSI) is nearing overbought territory, a space short-term sellers will be watching closely for signs of bearish intent on the price chart.
Observed Technical Levels:
Author

Aaron Hill
FP Markets
After completing his Bachelor’s degree in English and Creative Writing in the UK, and subsequently spending a handful of years teaching English as a foreign language teacher around Asia, Aaron was introduced to financial trading,


