Dollar breaks down; Copper tests opportunity - Reversal or continuation?

The markets didn’t hesitate.
The dollar lost key levels and confirmed weakness, while copper quietly moved into a technical spot that could define its next bigger move. One market is already reacting. The other is just getting ready, and that’s where today’s opportunity sits.
USD (DX.F): Breakdown confirmed, pressure builds
Before diving in, let’s revisit yesterday’s quote:
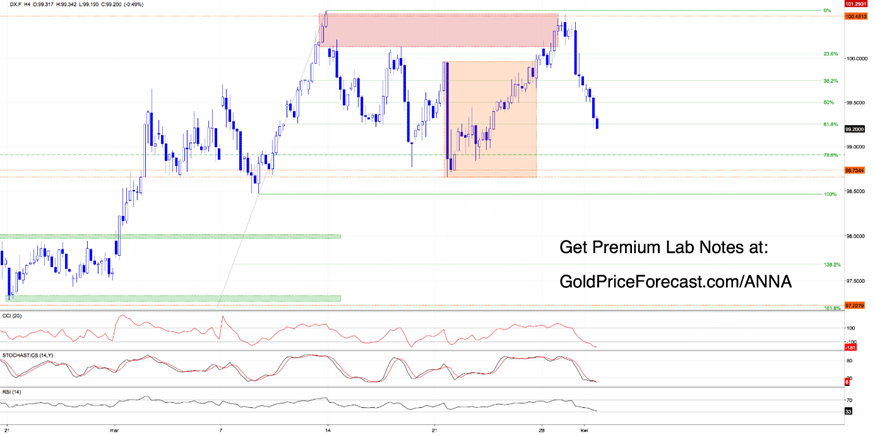
“(…) The dollar not only reached our yesterday’s initial downside target, but it pushed even lower, invalidating the earlier breakout above the upper boundary of the orange consolidation on H4.
And that’s where the shift happens… (…) H4 indicators are now (…), generating sell signals and supporting the case for further downside.
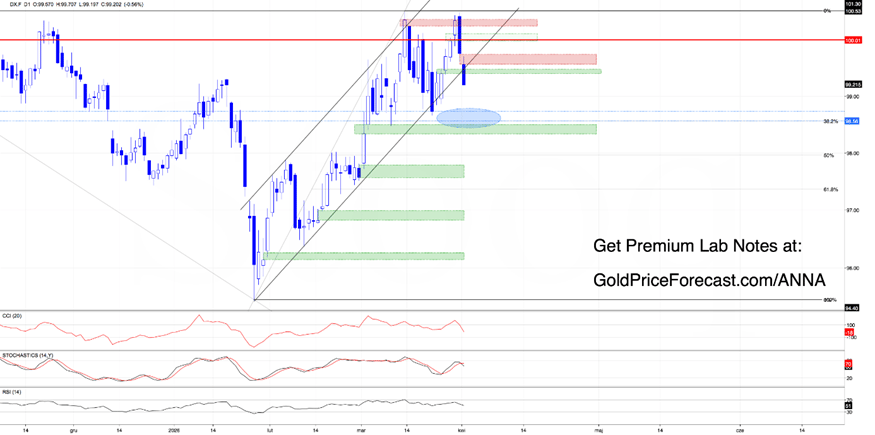
(…) In our opinion, the next battlefield sits around the bullish gap from March 26 (99.40-99.46), which also aligns with the lower boundary of the rising channel on the daily chart. (…)”
Looking at the charts today, we see that the shift is clear.
Yesterday’s invalidation of the earlier breakout above the orange consolidation gave bears exactly what they needed - confirmation - and they didn’t waste it.
The session ended not only below the key 100 level, but also with a bearish engulfing pattern on the daily chart, which immediately shifted sentiment and Asia picked up on that.
The session opened with another bearish gap (99.57-99.76), and after a failed attempt to close it, sellers stepped in again, pushing the dollar straight into our downside target.
But they didn’t stop there.
The last week’s gap was fully closed, and with daily sell signals now active, pressure remains firmly on the downside - especially if today’s session also closes below the lower boundary of the rising channel (marked on the daily chart).
If that happens, the next downside zone comes into focus:
• 98.56-98.73, sitting just above another key support
• the March 3 bullish gap (98.34-98.50)
Together, this creates a strong support cluster and the next real battlefield.
But bulls are not completely out yet. H4 indicators are already in oversold territory, which combined with the 78.6% Fibonacci retracement, could trigger a very short-term bounce.
If that happens, price may attempt to move back toward the previously broken lower boundary of the rising channel, however, here’s the key: as long as we don’t see a daily close back above that level, any rebound should be treated as a verification of the breakdown - not a reversal.
Before we move on, a quick shift in focus.
In previous Lab Notes, the dollar analysis was usually followed by a deeper look at gold and silver. Today, that part has already been covered earlier (in the Premium version) - including the key scenarios and levels that may prove decisive for their next moves.
So, instead of repeating the same structure, let’s use this moment to look at a chart that has just moved into a particularly interesting technical spot - one that could soon turn into a key decision point.
Copper (HG.F): Quiet setup at a critical level
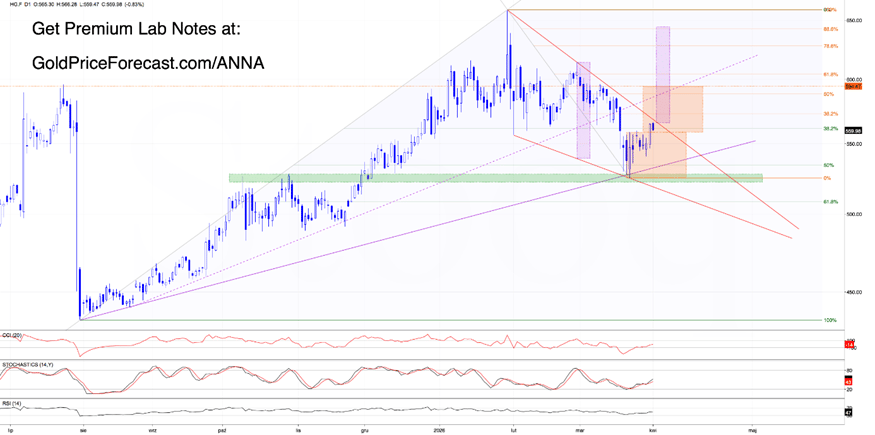
Looking at the daily chart, we see that the sell-off that started in late January brought copper straight into a strong support zone, built on:
• the 50% Fibonacci retracement of the prior rally
• previously broken highs from October
• the mid-December correction low
• and a medium-term rising support line
That’s a lot of technical weight in one place.
And it worked.
Buyers stepped in, but instead of a sharp reversal, the market entered a multi-day consolidation just below the first resistance: the March 19 bearish gap. At the same time, daily indicators turned bullish and that combination led to yesterday’s move.
Buyers attacked, closed the gap, and broke above the upper boundary of the consolidation, activating a bullish scenario, which could take copper to around 595.
Sounds good, right?
Yes… but there’s a catch.
Right above current levels sits the upper boundary of a declining wedge, and that’s the real test.
Why?
Because breaking out of this wedge → the rest of the analysis is available in the full analysis today.
Today’s Takeaway
Dollar: bearish pressure remains in control. The breakdown below 100 and confirmation from price action shift the bias to the downside. Watch 98.56-98.73 and 98.34-98.50. If this zone holds = possible very short-term bounce, however, if it breaks = downside continuation. But remember: no daily reclaim = no reversal.
Copper: bullish setup, but not confirmed yet. (…)
Execution Plan: don’t rush into reversals on the dollar - wait for confirmation. Treat bounces as technical reactions until structure changes. On copper, (…)
Want free follow-ups to the above article and details not available to 99%+ investors? Sign up to our free newsletter today!
Author

Anna Radomska
Gold Price Forecast
Anna's passion for drawing evolved into a fascination with colorful lines and shapes, which later inspired her interest in the stock market.