Democrats’ win sweeps the markets

Democrats seem to be winning in a landslide
The blue wave is sweeping the markets as the Democrats seem about to flip both houses of Congress. US stock markets edged lower as additional regulation may apply, especially for AI, weighing on market sentiment. Furthermore, the control of Congress by Democrats could severely limit fiscal policy, given the high US national debt, thus also weighing on the USD. Also cryptocurrencies could be set under pressure as legislation for the crypto environment may become harder. Yet on the flip side the results seem to be boosting Treasuries and gold’s price on speculation that the result will put the brakes on President Donald Trump’s agenda. We expect these reactions to be maintained if not enhanced as the win of the Democrats solidifies.
BoE expected to hike rates yet will is signal more to come
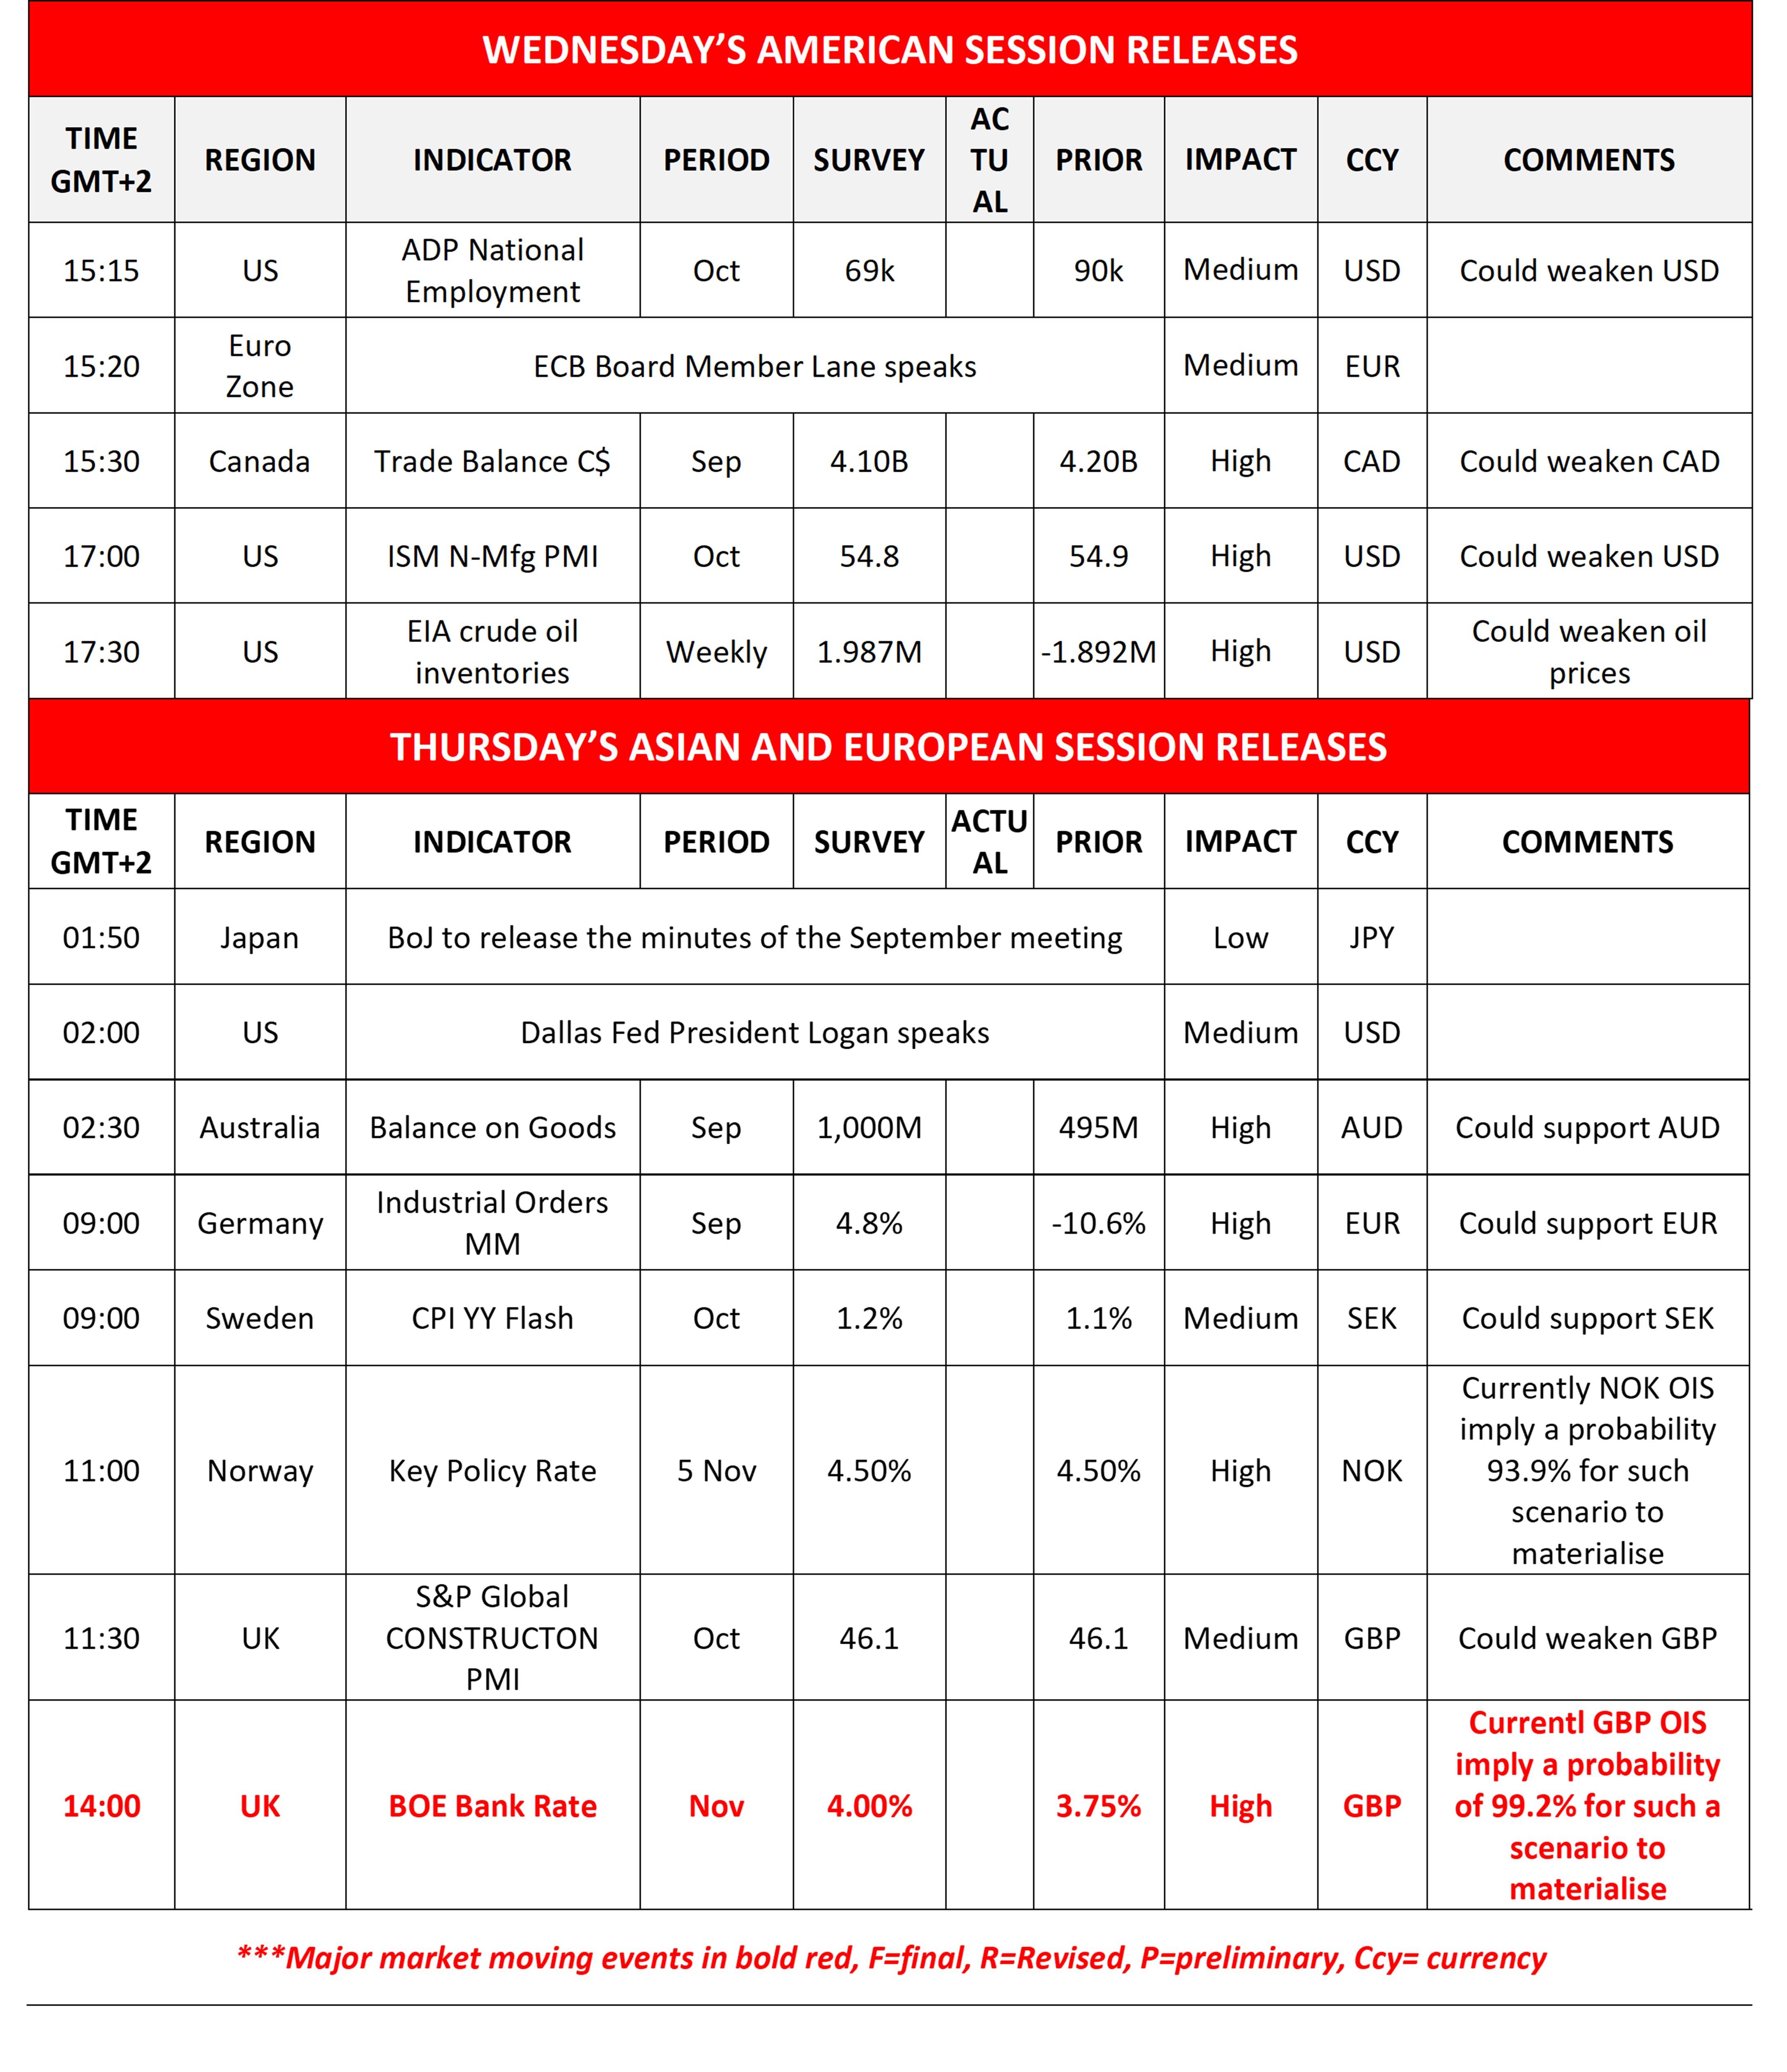
Bank of England is expected to hike rates in tomorrow’s late European session, and currently GBP OIS imply that the market has almost fully priced in such a scenario currently. The market also expects the bank to remain on hold in December and resume its monetary policy tightening from February onwards. Should the bank hike rates as expected and at the same time signal in its forward guidance hesitation to continue tightening, we may see the GBP losing some ground as the market’s expectations for a pause could be enhanced. The market moving scenario would be if BoE sounds hawkish which could send the pound flying.
Oil prices stabilise
Oil prices edged higher in today’s Asian session as oil traders await the next US move in the US-Iran conflict given the win of the Democrats in the midterms. We are quite worried for the situation in the Gulf region, as the US had warned for a short but intense military operation after the elections with analysts speculating the deployment of the Mother Of All Bombs (MOAB) a scenario that could open Pandoras box. Further escalation could lift oil prices, while a possible easing of the oil market’s worries, could weigh on oil prices.
Other highlights for today
In today’s American session, we note the release of the ADP national employment report for October and the US ISM non-manufacturing PMI figure for October while ECB’s Lane speaks. In tomorrow’s Asian session, BoJ is to release the minutes of its last meeting while Dallas Fed President Logan speaks. In the European session, we get Germany’s industrial orders for September, while Norgesbank is expected to remain on hold.
Charts to keep an eye out
GBP/USD rallied yesterday, aiming for the 1.3510 (R1) resistance line. We maintain the bullish outlook for cable, given that the upward trendline guiding the pair is still active. The RSI indicator nearing 70, implying a bullish market sentiment for GBP/USD. Yet the pair’s price action has reached the upper Bollinger band, which may slow down the bulls if not even cause a correction lower. Should the bulls maintain control over GBP/USD, we may see it breaking the 1.3510 (R1) line and aim for the 1.3655 (R2) resistance level. Should the bears take charge we may see the pair, breaking the prementioned upward trendline signaling an interruption of the upward motion and break also the 1.3300 (S1) line and aim for the 1.3155 (S2) level.
Gold’s price rose breaking the 3960 (S1) resistance line, now turned to support. In its upward movement the precious metal’s price seems to break also the downward trendline guiding gold’s price. The RSI indicator has risen nearing the reading of 50, implying a considerable easing of the bearish market sentiment. Should gold’s price remain above the downward trendline signaling an interruption of the downward motion, we would switch our bearish outlook in favour of a sideways motion bias. Should the bears regain control over gold’s price, we may see it breaking the 3960 (S1) line and start aiming for the 3600 (S2) level. Should the bulls take over, we may see gold’s price rising further aiming if not breaking the 4275 (R1) line.
Calendar follows
GBP/USD daily chart
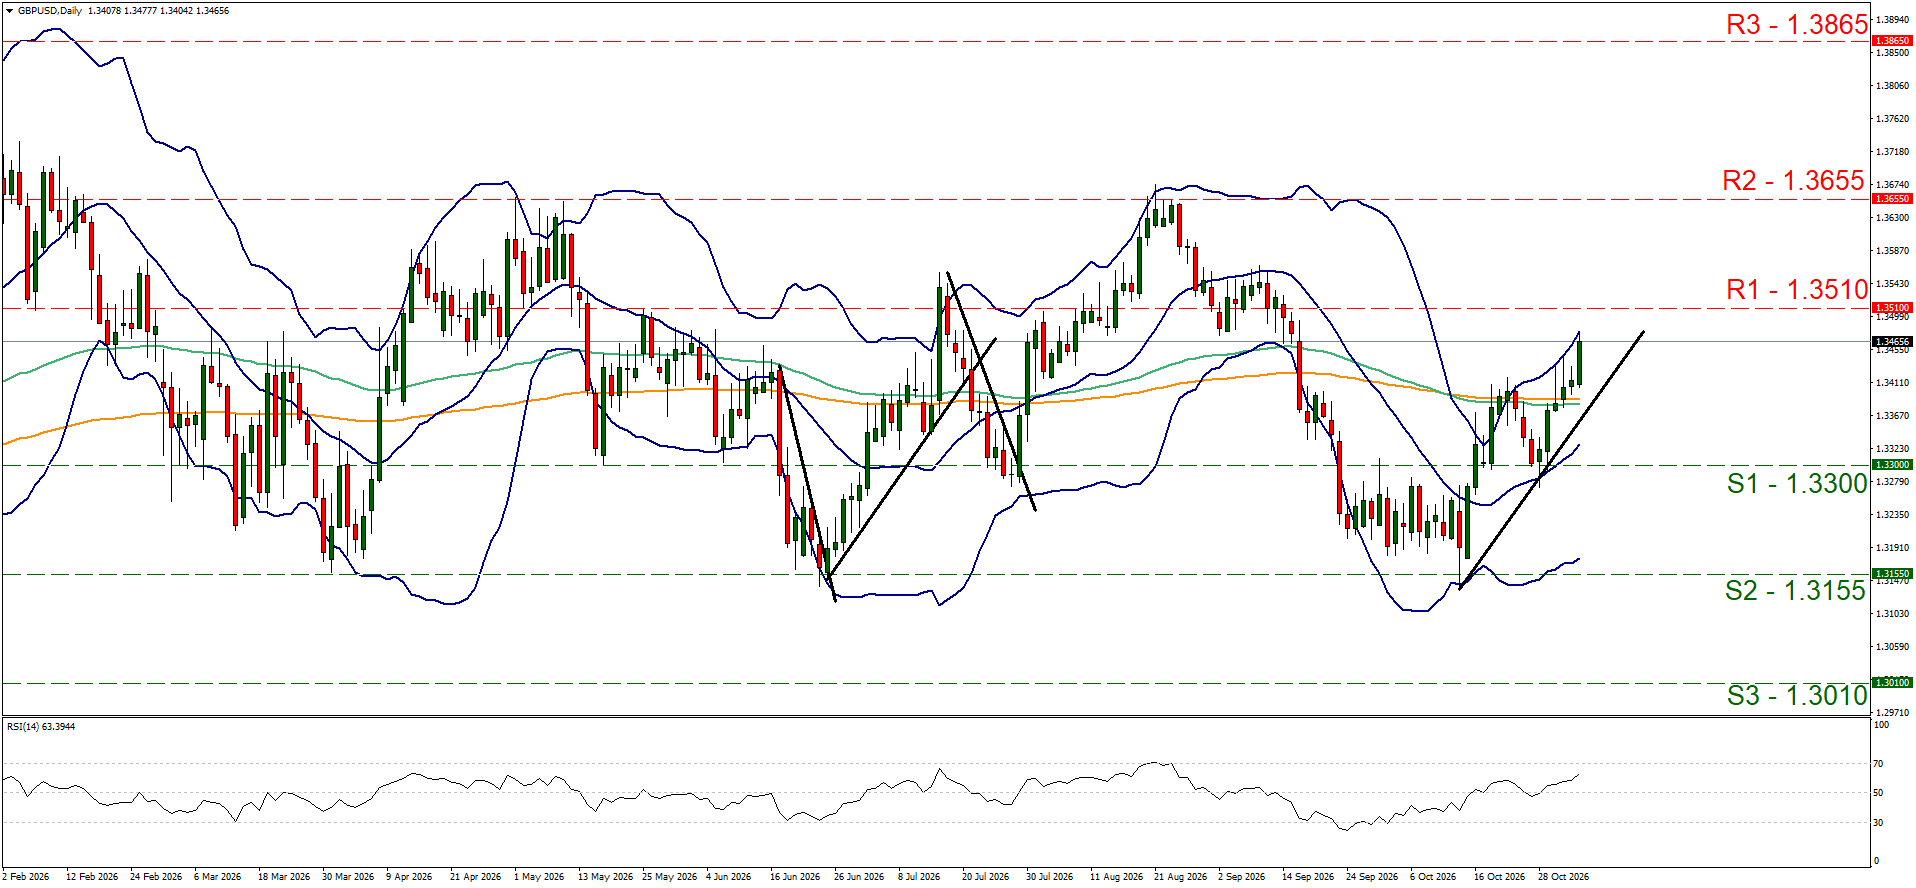
- Support: 1.3300 (S1), 1.3155 (S2), 1.3010 (S3).
- Resistance: 1.3510 (R1), 1.3655 (R2), 1.3865 (R3).
XAU/USD daily chart
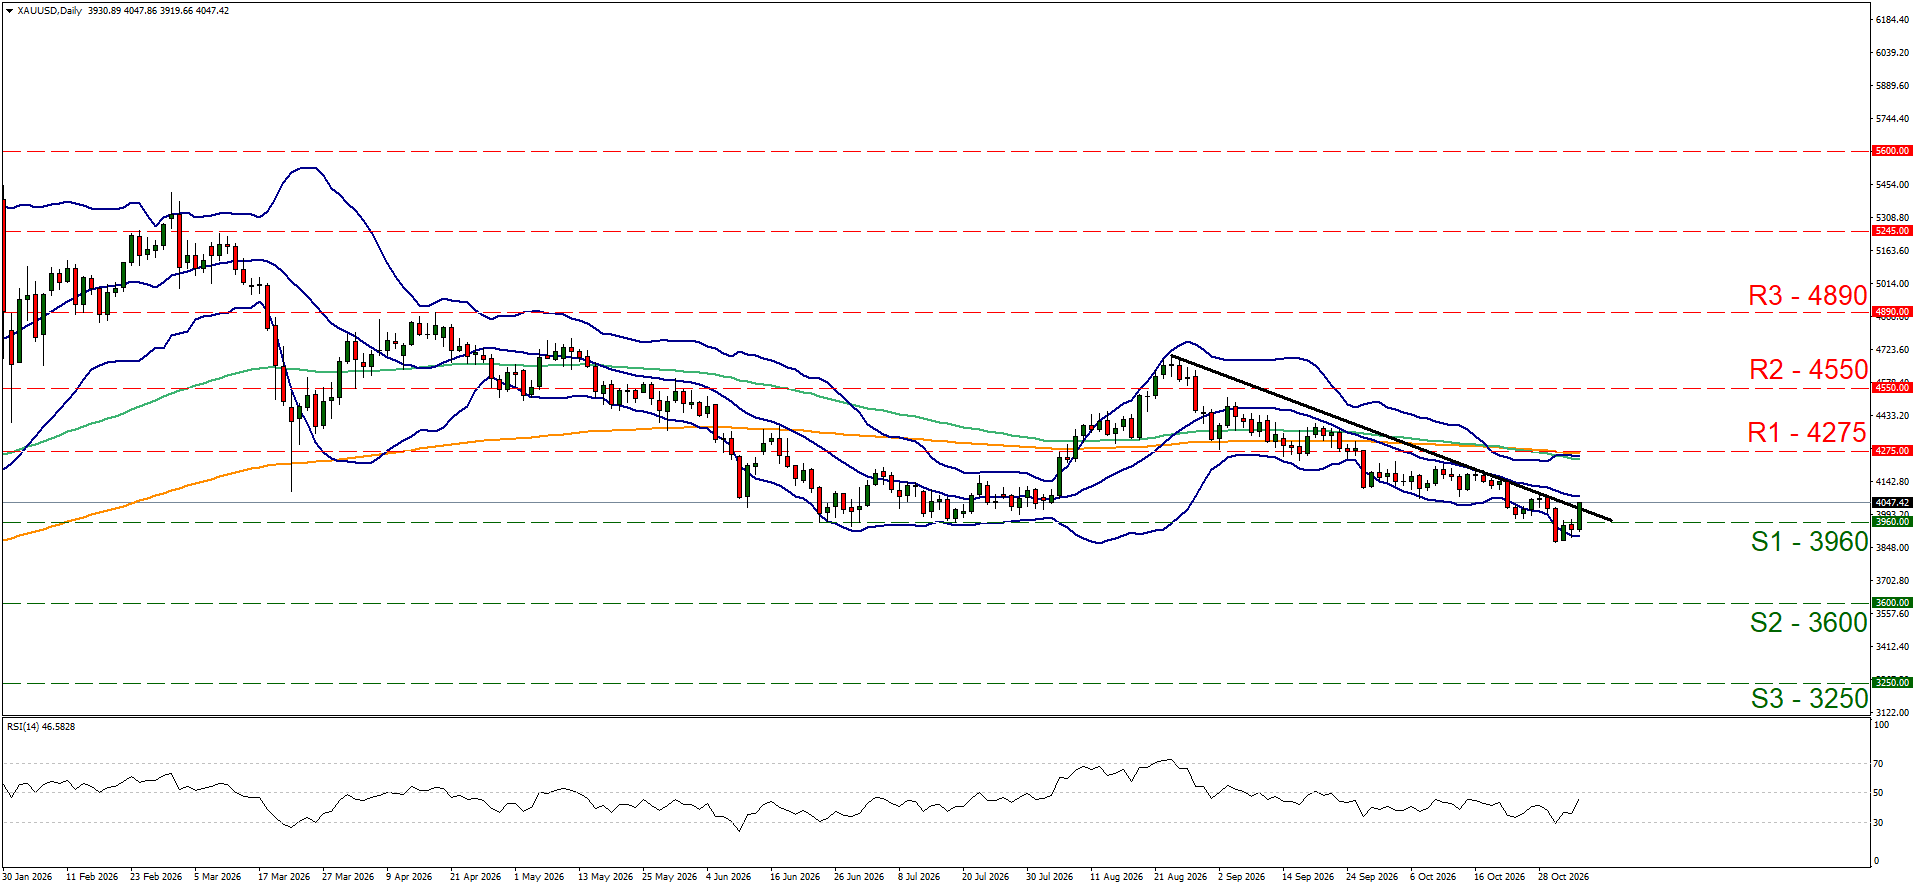
- Support: 3960 (S1), 3600 (S2), 3250 (S3).
- Resistance: 4275 (R1), 4550 (R2), 4890 (R3).
Author

Peter Iosif, ACA, MBA
IronFX
Mr. Iosif joined IronFX in 2017 as part of the sales force. His high level of competence and expertise enabled him to climb up the company ladder quickly and move to the IronFX Strategy team as a Research Analyst. Mr.